
Welcome to the new Traders Laboratory! Please bear with us as we finish the migration over the next few days. If you find any issues, want to leave feedback, get in touch with us, or offer suggestions please post to the Support forum here.

That One Guy
-
Content Count
81 -
Joined
-
Last visited
Posts posted by That One Guy
-
-
Anyone still alive out there?
-
To anyone currently doing Insanity, I just started the 2nd phase..........
Get ready to be destroyed!
For instance, most of the stuff you do in 1st half is now the warm up in the 2nd half.
-
I found this article:
From Geek to Freak: How I Gained 34 lbs. of Muscle in 4 Weeks
and started doing a routine based on the colorado experiment as was getting as good of results doing that routine twice a week for an hour and doing some other cardio on my off days.
Remember - Muscle is built resting - not working!
I saw that he is writing a book about this stuff.
THE NEXT BOOK: From Rapid Fat Loss to Strongmen: A Guide to Becoming Superhuman
If anyone is interested in bodyweight training, this is a good resource.
-
Something I am looking at for the Nq. Its pretty evident the nq is becoming tired and even exhausted, trying to break above this 1750 Resistance area.
.thumb.jpg.945c2eba853bafbfcbac53d9fd6525f1.jpg)
-
I am doing insanity right now. Interval style training will kick your ass regardless of your fitness level. Nice results from the P90x 1st run. Try to eat several hours before doing the insanity workouts, otherwise you may lose your lunch.
-
As of today, I am taking a hiatus from chat to step back and figure some things out. Chat has been a good help to me over the year and half, but it's time for me to move on and put together the stuff I have learned. To all those in the chat thanks for all the help.
P.s. I am considering a blog to keep a running journal of trade ideas.
-
I did some p90x back in 2007 and lost 35 pounds. One thing I must stress is eating a good diet. My diet consist of almost even proportions of fat, protein and carbohydrates. I read once from a workout guru, "you can't out train a bad diet.". Keep this in mind as you push through the p90x workout system. Recently I have been running one p90x workout, called Interval X plus. After lots of reading, I found lots of good information about high intensity interval training. Either way, best of luck to you and as I always health before wealth.
-
Interesting post from Steenbarger.
TraderFeed: Integrating Indicators for a Multifaceted Market View
Points out 65 day highs minus lows still expanding, but the 20 day highs minus lows has started to flat line some. With ES and Nq pushing to some big resistance zones, I wonder if the market will starting turning more sideways here. Vix has basically been trending down each day, so its clear fear has come off some, but at the same time people are maybe getting too complacent. Still have some big earnings on the table next week.
-
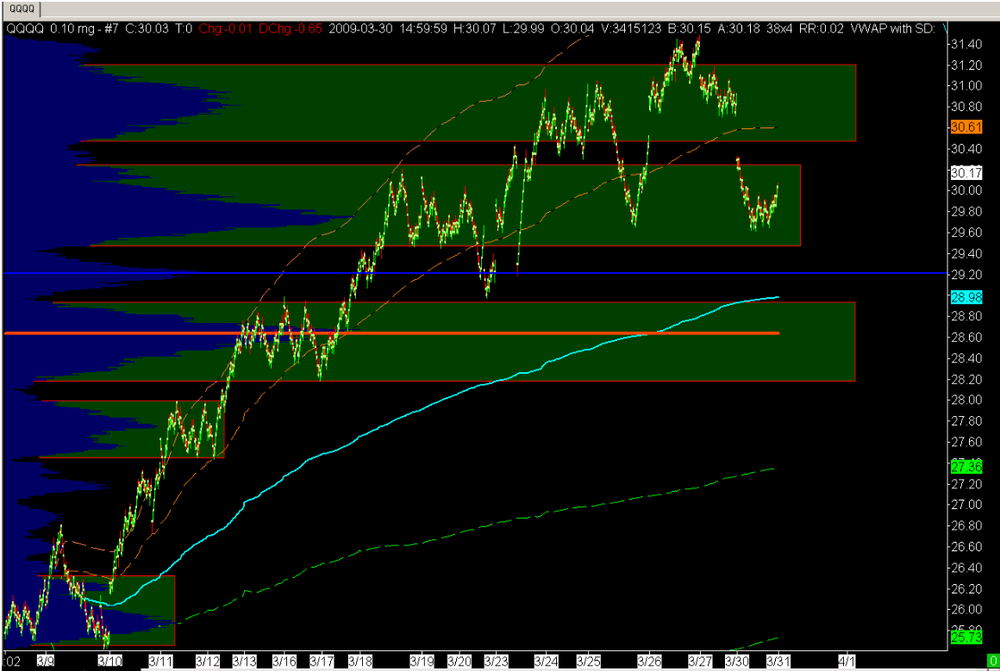
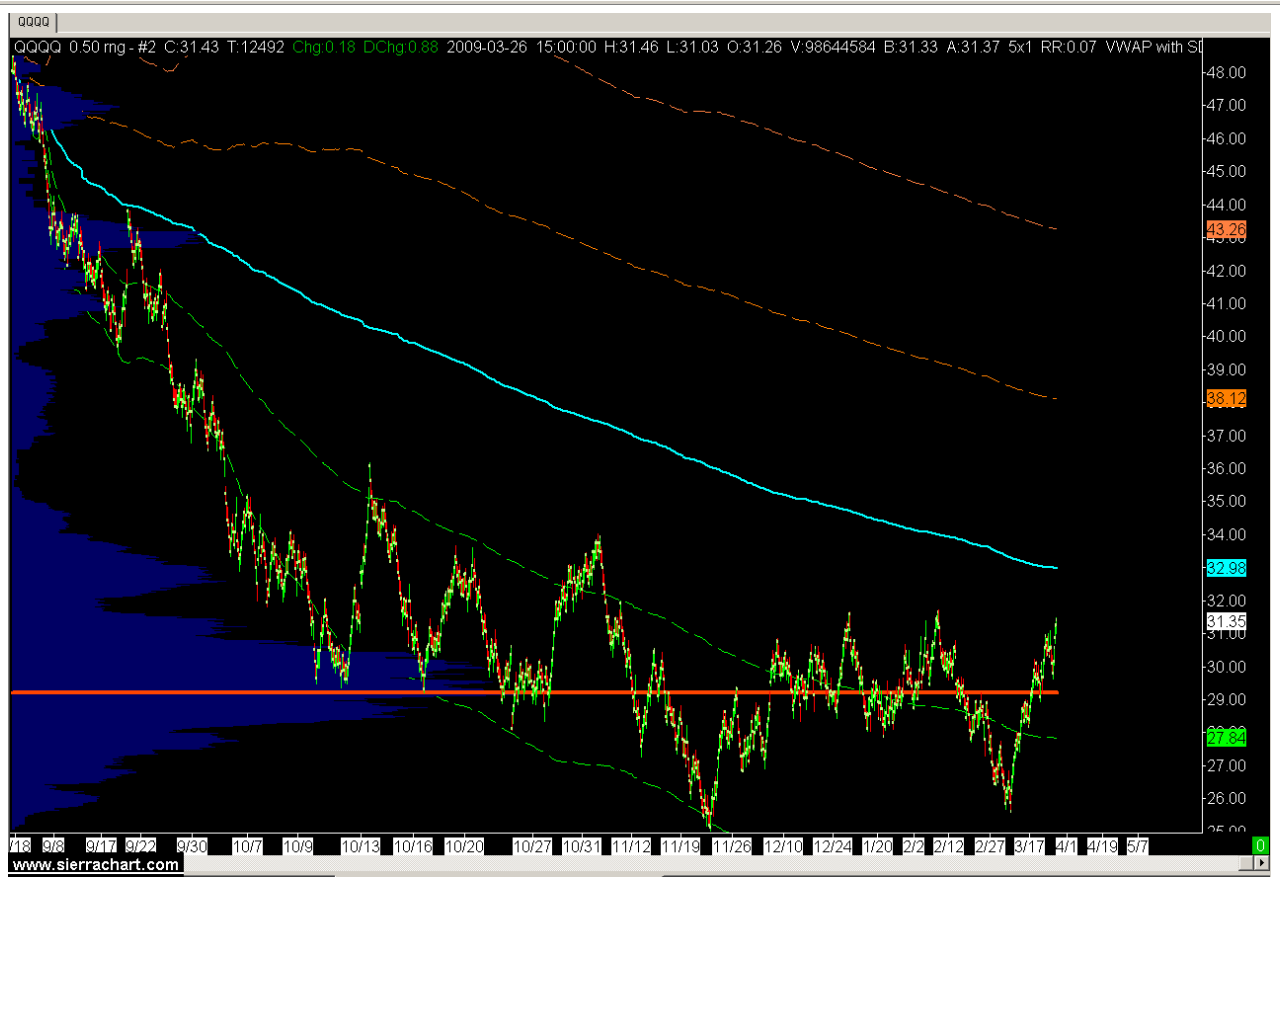
This is QQQQ from the march low bottom. We see 3 distinct volume at price peaks, where price may clearly have a memory. As you can see today we pushed to one of these volume peaks and went sideways almost all day.
If the buy the dips mentality is still intact, (even know we haven't broken 1285) I would watch these ares to see if buyers re-emerge. Currently that seems to be the case.
I am watching some short term areas for the market to trade back up to, to retest buying interest back above, and potentially see shorts re emerge to try for another bearish push lower.
Any other views of the current price structure for the NQ or ES would be highly appreciated.
Thank you
-
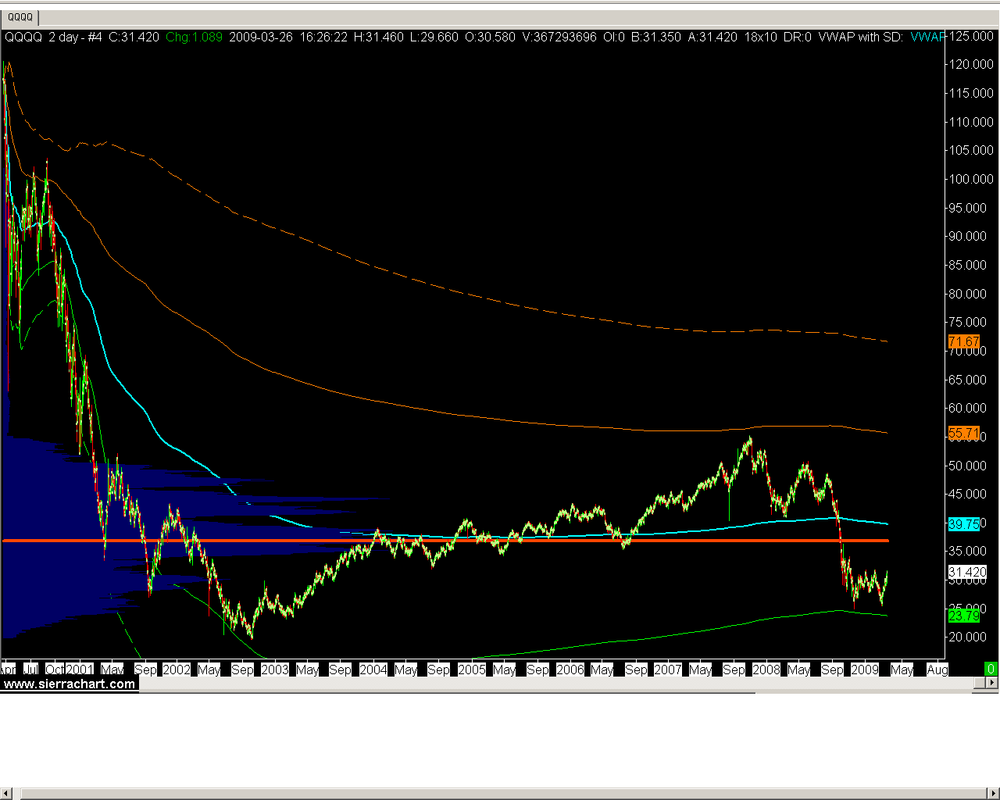
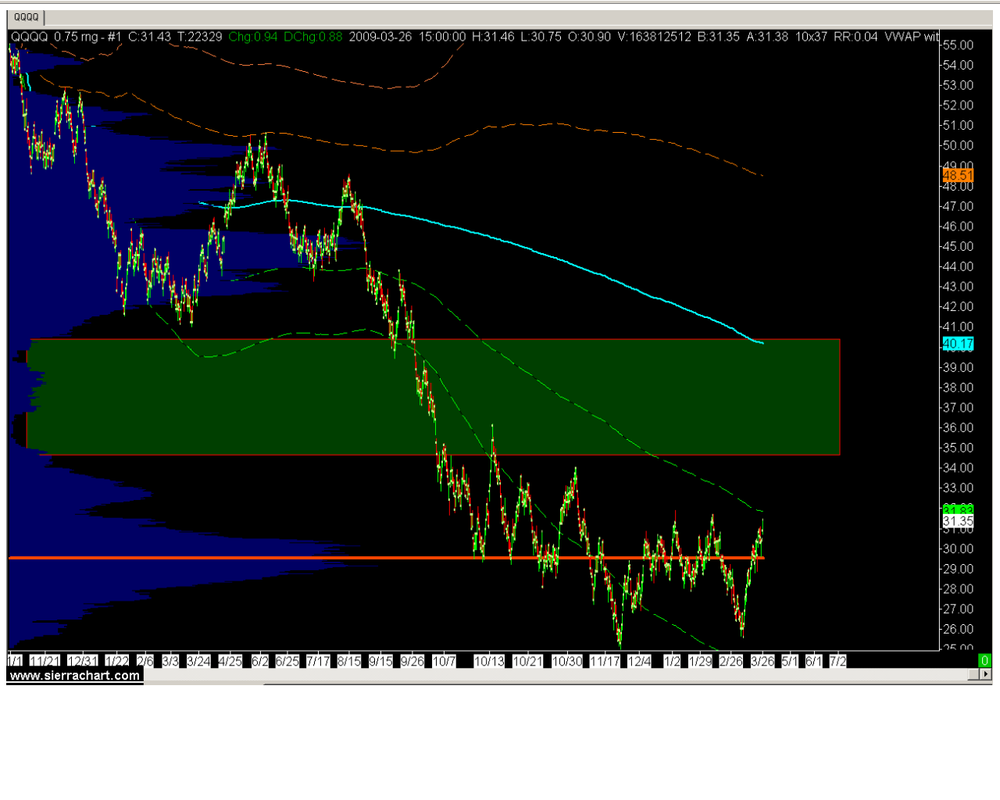
I played around with some historical data for the QQQQ. Here is the volume distribution from the 2000 highs to now. Interesting to note that we stopped at Upper value in 2007 and now stopping at lower value here in 2009. I wouldn't be surprised if we trade back up to 40 in the QQQQ, which would be the 2008 lows.
Lets dial in a little further and look at the the distribution from the 2007 highs.
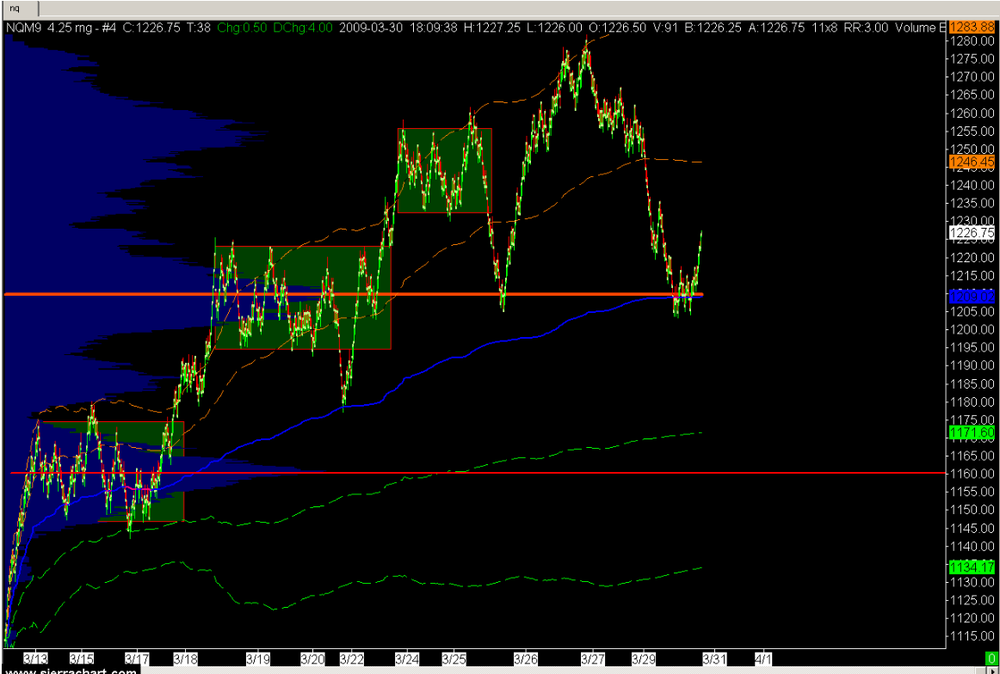
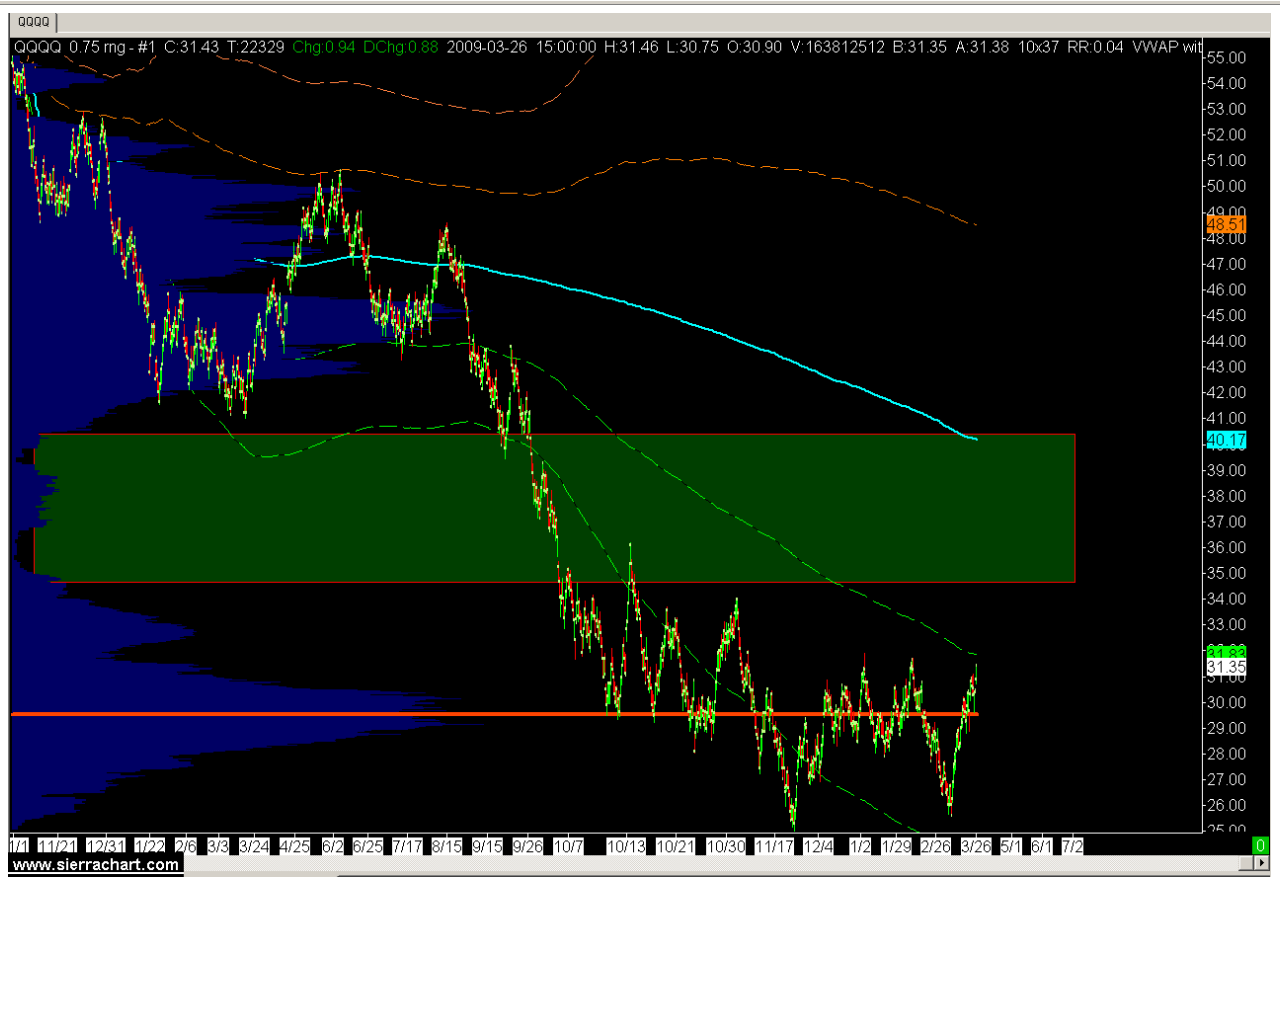
You will note the massive volume building up down here at the lows. The fact we are coming into developing value (green dashed line) and that there is a massive gap in the volume profile where price spent little to no time trading there. Looking at all this, if the bulls can gain more control of price and find interest above this 1285 area on the NQ the potential for a decent rally taking us back to 2008 lows, is definitely in the cards.
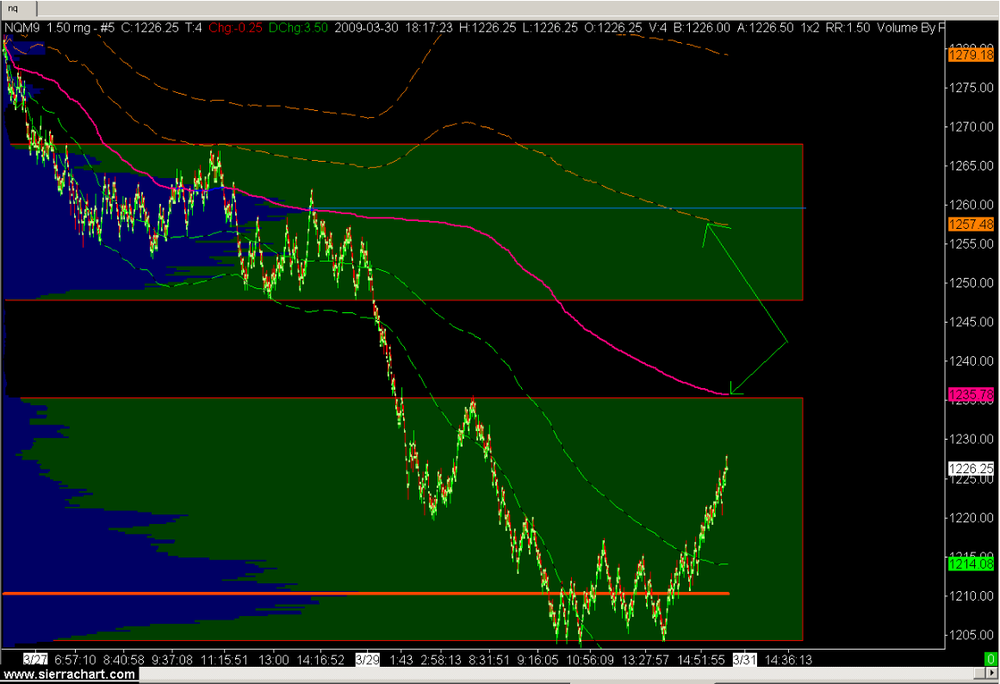
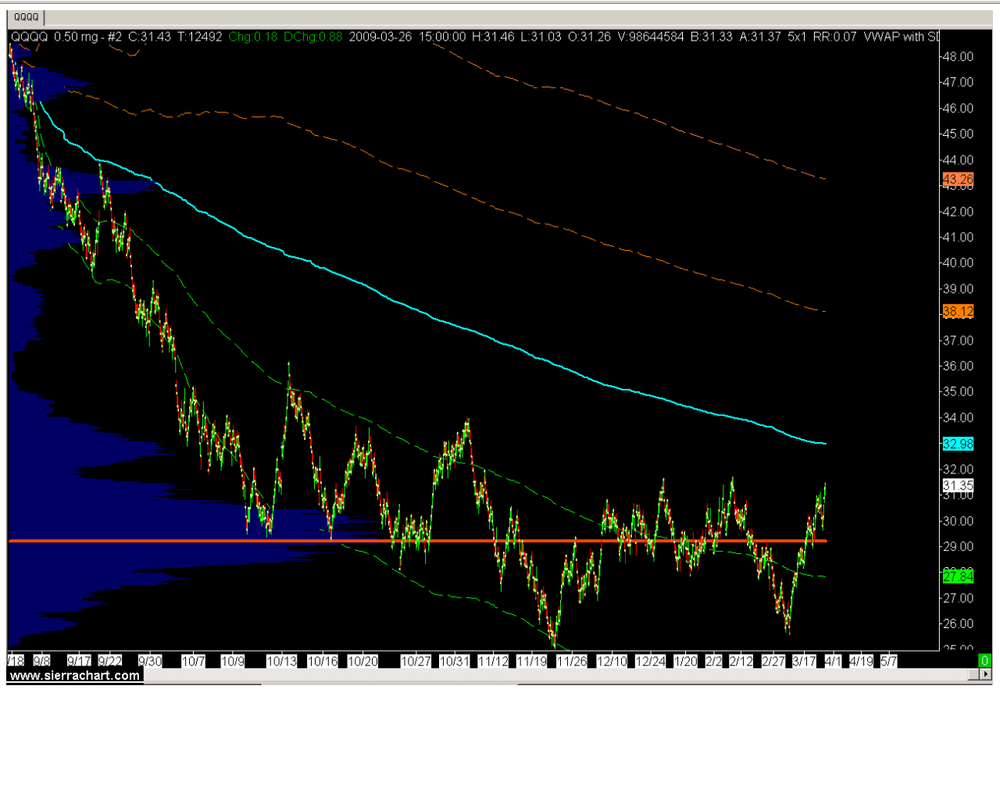
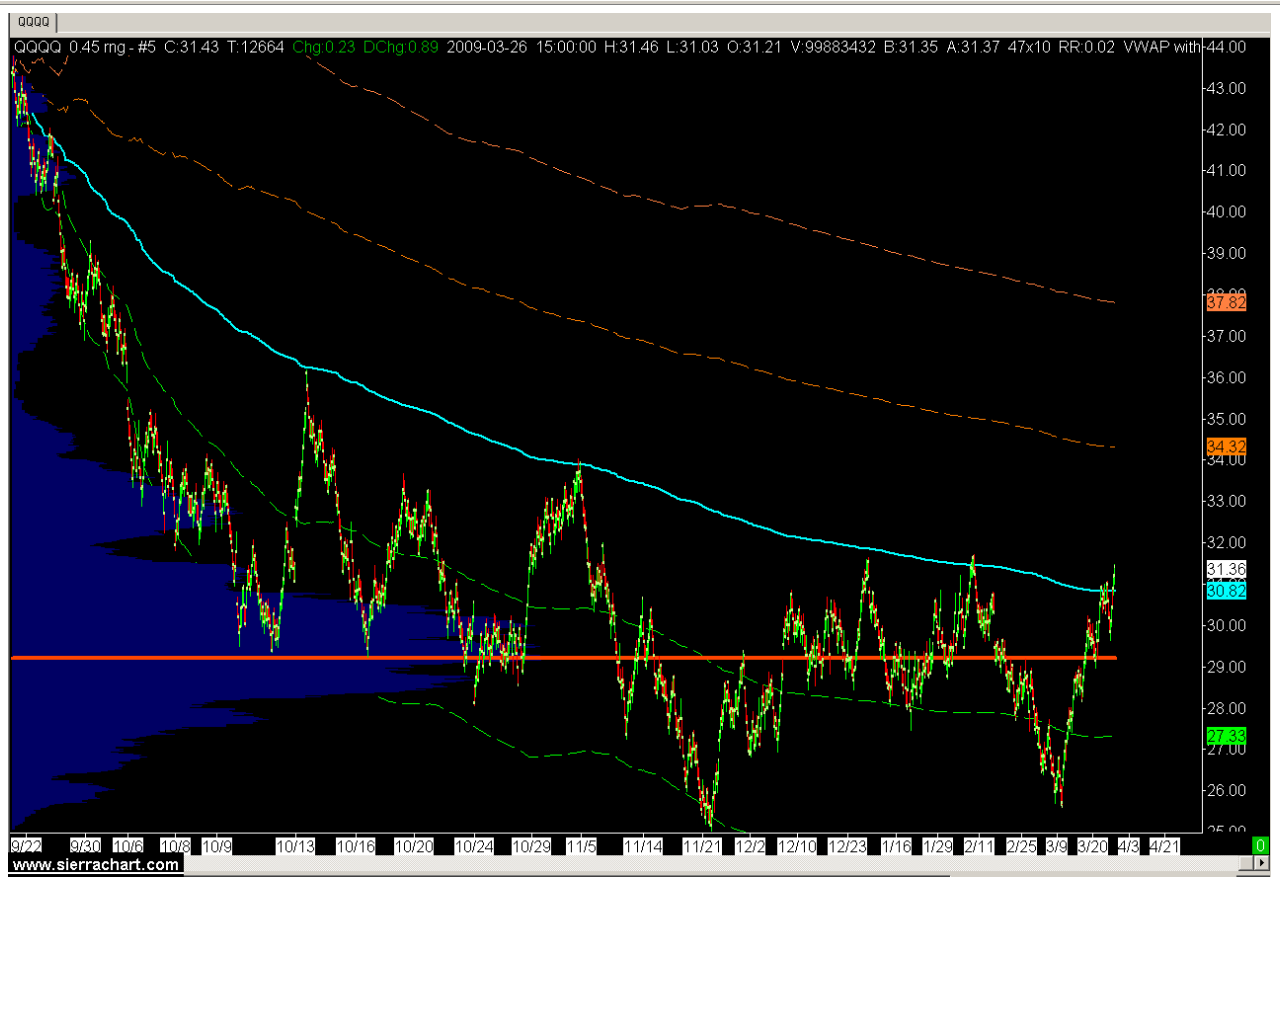
We can zoom in a little further to look for some short term potential resistance that may cause a problem on the way up. Here we see the market from the August highs to now. We see volume has been heavily distributed here at the lows. We have now pushed back into developing value for that time period and heading back to the mean. A push into that mean may be a place for this short term rally to stall out and see a decent pull back.
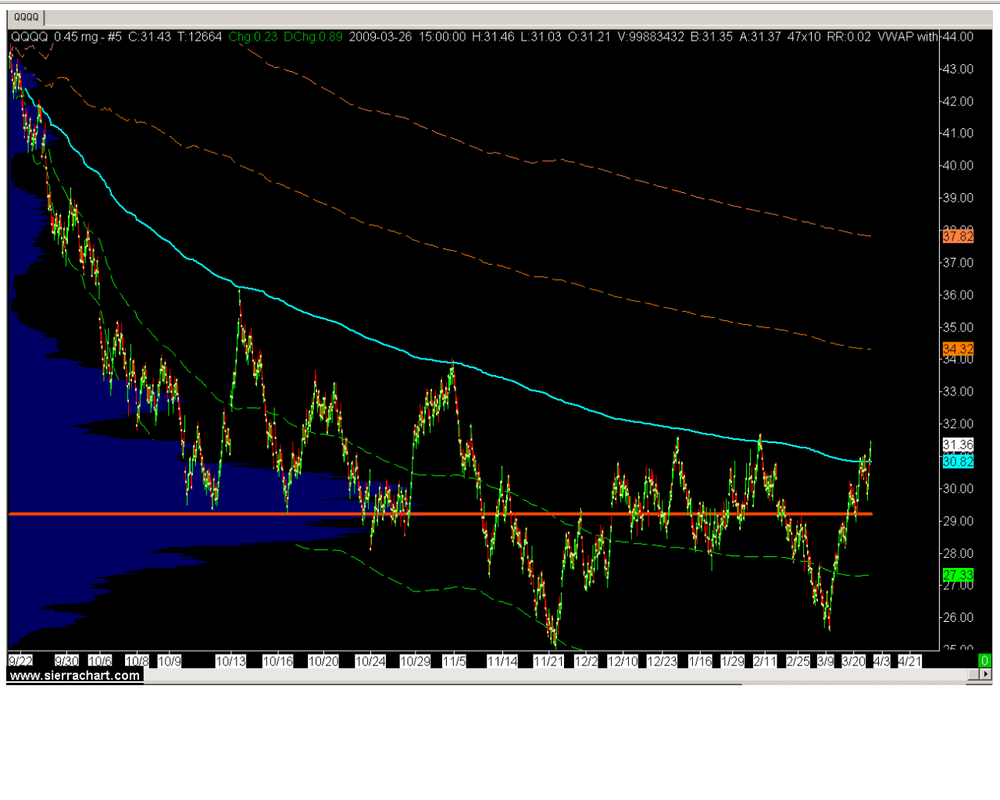
Looking at all the above charts you can see we have extended down far from the mean of each of those time frames. However, take a look at the one that has seen the most activity since it has been set in motion. From this time frame (9/19/08 swing point and test of August swing high mean) we are starting to push above the mean(POC, mid point) with the volume being heavily stacked below us, the people on the wrong side of the trade, may exit this market furiously and we could see a push to the upper extreme of this time frame. View this information any way you want, I am just building a case for a decent market rally that could last well into the summer. (just like last year)

Any thoughts on these ideas or criticism will be greatly appreciated, thanks for your time.
-
OpenEcry already has MP compatible thru its plug-in Market Delta.Yeah, but I still have pay for market delta. Having no data cost and no charting fees is awesome, but if I am having to pay more money to get a few additional features, it takes away from all of that. I'm a real cheap guy, so having low cost to do business without sacrificing the needed tools is number 1 for me. If the features I listed above were added, OEC would be an unbelievable deal.
-
Some may have been stated, but here it goes:
1. Market profile daily (TPO, Volume)
2. Sub 1 minute charts (5 second, 30 second etc.)
3. More historical intraday backfill (Tick) or the ability to catch intraday tick data for later backfill
4. Dynamic Volume at price, not just 24 hour like OEC currently has.
These additions would make OEC very competitive, currently you have to go to sierra ($26 a month) to get dynamic volume at price and and market profile. Also any kind of Drag and drop integrated into OEC would be spectacular, because I only know of 2 platforms with drag n drop.
-
Hope all of you are doing well and have been trading well in the volatility.To this atto, the only way I can explain how I have been doing is this....
[ame=http://www.youtube.com/watch?v=HuGIgf-ICHM]YouTube - The Office - I declare bankruptcy! Michael Scott[/ame]
Glad to see you back
-
Hah!! ignore the above post because I failed to read the words
"Eliminate the worst of the bubbles, and returning to the trendline doesn't seem so outlandish after all"
Oh well, another notch in my idiot belt and confirms what everyone already knows.
-
Eliminate the worst of the bubbles, and returning to the trendline doesn't seem so outlandish after all:Is it valid to place trendlines on this same chart like so:
Which would be fanned up to indicate increased momentum to the upside. If my picture is valid, then we are still seeing the up momentum from 95 lows.

-
I was able to get back into chat
-
Yeah, soultrader seemed to be very busy earlier this morning. He didn't mention anything about what he was doing, and I am sure hes in a deep sleep by now. Hopefully we can get back on the chat tomorrow.
-
I found this post on "Re: All You Need... is a Chart" interesting and have nominated it accordingly for "Topic Of The Month January, 2009"
-
Yeah, I’m totally good with simulation mode. But thinking about it now I haven’t traded simulation for over 6 months. I have had some incredible consistent success for 4 months straight, then had a mindset shift and have been struggling with executing trades based out of fear. You’re right; I am breaking the circle now. I’ll do these then, take my hand off the mouse and get away from the computer.
I read an article on Bret Steenbarger's blog a while back. This part stood out to me and what it seems like you are going through.
In a subsequent communication, the trader revealed to me, "Each of these bigger losses occured after a period of very good trading. I didn't feel cocky, but my actions were. I cannot increase my relative risk tolerance after a period of success." This is a very good observation. The problem pattern is NOT triggered by a losing trade. It is triggered by success! After a winning period, our trader becomes emotionally attached to winning: he wants to eradicate losses. This has him resisting taking normal losses at his stop points and instead averaging down to minimize the loss. It's not that he's trying for a home run trade: he doesn't want to stop winning.
I don't know if this is the issue you are experiencing , but it seems similar. Instead of you taking big losses like the trader did in the article, you are simply not taking trades at all or hesitating.
Here is the full article if you want to check it out.
http://traderfeed.blogspot.com/2008/06/from-problem-patterns-to-solutions.html
-
I found this post on "Exits and Scale-outs" interesting and have nominated it accordingly for "Topic Of The Month November, 2008"
-
For sure.I was in the shower thinking about the common factors that I am starting to get together and I had a sort of epiphany. I don't think recognizing and cataloging them is enough. Well maybe its enough, but I think I should be doing more. For example lets say I noticed that price always behaves a certain way while vol is doing this during a RET. Shouldn't I be trying to find out why? Why is price behaving this way in the context of the overall picture? Or does that matter? It seems like it should matter in that understanding the market (human behavior) is our over all goal, right? Maybe its not so important in the system of a day-trader, but honestly I hate that description of what we do (or try to do). Day trading to me should be just a stop on the way to really understanding how the market works: fear, greed and their relationship to supply and demand. Thoughts? Is the "why" important?
Yes, learn what the market is telling you first. I've spent time trading live, trading sim and just watching. I, can personally say, just watching not really trying to trade what I'm seeing has been helpful. Once you gain a further understanding, of what the market is doing, knowing what to do is much easier. I am by no means an expert, but I started live and now basically just follow the market. I quit sim trading, because I never had a complete plan. This has been great though because now I am able to see whats going on in the market much better. I am hoping to eventually find ways to capitalize on all this with a consistent method.
-
The amount of rotation in the current markets alone, seems to be wild. Money is flowing in and out, all over the place. Maybe all this recent sector rotation craziness, has something to do with this OPEX?
-
Well I wanted to trade today. I just couldn't. I couldn't see anything worth pursuing. A couple times I thought I did. Then I would wait to see what else was going to happen and it just wouldn't make any sense. There was some decent stuff by the end of the day. Maybe I'm a failure. Anyways I will try again tomorrow. Hopefully the market will represent some opportunities that are easier for me to see.
Sounds like what I am going through. I don't know exactly what I am looking for. I want to play s/r, and trade with the trend, but I haven't defined a complete way of doing all that. Lately, I, have been doing exactly what you posted, and sitting there seeing things and just feeling lost. What I have, is a bunch of ideas, but they are all disorganized. I, need to spend time defining what exactly I am looking for.
-
I found this post on "Re: Support and Resistance" interesting and have nominated it accordingly for "Topic Of The Month July, 2008"
.jpg.56a4fdab94d16389e31dfdec25bf3ec1.jpg)


Chat Junkies
in General Discussion
Posted
Excellent man, how is all the hard work paying off? Are you still following a clean paleo diet? What about meditation? You planning on getting back to trading, or taking the summer off?