
Welcome to the new Traders Laboratory! Please bear with us as we finish the migration over the next few days. If you find any issues, want to leave feedback, get in touch with us, or offer suggestions please post to the Support forum here.


cattus
-
Content Count
63 -
Joined
-
Last visited
Posts posted by cattus
-
-
Hi Sparrow.
Ha, ha, ha... Yes, Forex is like a wild wild animal... What are you scalping? e-mini?
Very interesting the strategy of Woodie. In fact, like Walter mentioned in one post, the average of effectiveness is around 50 gains:50 losses. I know that some guys have strategies more effectiveness: 60 gains to 40 losses are great numbers. And I think that the comment on the blog is true, the key is the RRR, like Walter have said, because profit:stop loss of 1.5:1 or 2:1 do the work that we are looking for, well, if we have at least an effectiveness of 50:50 :o
I will probe the strategy of Woodie, demo of course...
.... I am learning too....
Cheers.
Cattus
-
Hay Sparrow, the "post" does not work...
mmmm, some persons make money in the trading with indicators, others with the price action... others with both.... each of us have to choose our comfortable strategies to reach the success...
I have been thinking about the techniques purposes for our friend Walter, in the thread
http://www.traderslaboratory.com/forums/f34/s-and-r-scalps-2990.html,
they must be good for your intention to scalp the levels...
Cattus
-
I think we are looking at the same things then, I don't use the open though.Here's something you don't have yet. Found it by accident today.
I'm just trying to scalp these levels, but since they are zones as you mentioned, it is quite difficult to tell if price will go through or reverse. I don't have any intention to go back to indicators.
Here's a link against MACD btw.
Cheers
Well, I think that the Structure and the Patterns are the kings, but I also think that the indicators are good tools of support, but if we choose just one or two and study them in depth, very deeply... it is my opinion, but I can be wrong...
The links you put here looks very interesting, thanks.
Cheers.
Cattus
-
Sorry, I forgot to mention the trendlines...
Cheers.
Cattus
-
I define in a simplistic form the structure of my charts, of the pairs like EURJPY:
Psychological levels: .00 or .50
Possible psychological levels: .20 to .25 or .75 to .80
High of the previous sesion
Low of the previous sesion
Open of the sesion
Pivot Point (only the central pivot point)
And to identify intraday important levels, I am using the indicators Swing(5) and Fractals.
Continuous reactions of the price on those levels indicate the strongest levels.
I do not use data of volume, because unfortunately the volume in the forex is not credible. The volume data can be very slanted to the data and strategies that use traders from where those data come.
All the levels I put, I understand that can be zones, not precise points of the price...
When you identify some techinques I will be happy to hear about them....
Salu2.

Cattus
-
Hi Sparrow.
I know that you understand the importance of the price action, but anyway, let me tell you that about the different areas of the analisis, I have the following order of importance for those areas:
1st. Structure. There are important levels for each pair or another kind of instrument. The price moves from one level to other level.
2nd. Patterns. When the price react to the levels create patterns. Some patterns work better than others in order to predict the action of the price. Ms(Ws) are a good example of some kind of patterns.
3d. Indicators. It help to us to understand the momentum, to see specific signals, to see the action of the price like an oscillator (with its benefits), etcetera.
I always try to understand the market in my analisis by those order, but let me tell you that I fight all the time in order that the indicators does not rob all my attention, because it happens to me very frequently...
Well, I just wanted to comment that....
Cheers.
Cattus
-
Hi Sparrow. My apologizes for my delay to answer your request, but you know, the rest days... I just read this thread yesterday....
I requested for help to do the Guppy MACD and Sparrow helped me to do this indicator to use in NT. Thanks again for this, Sparrow.
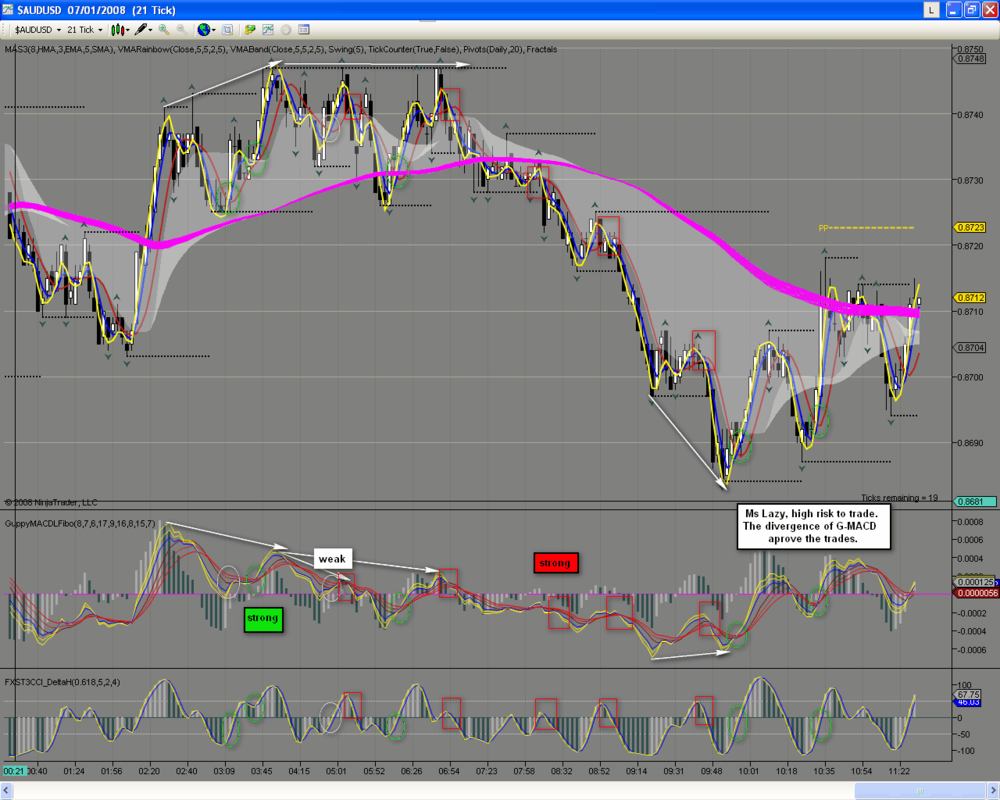
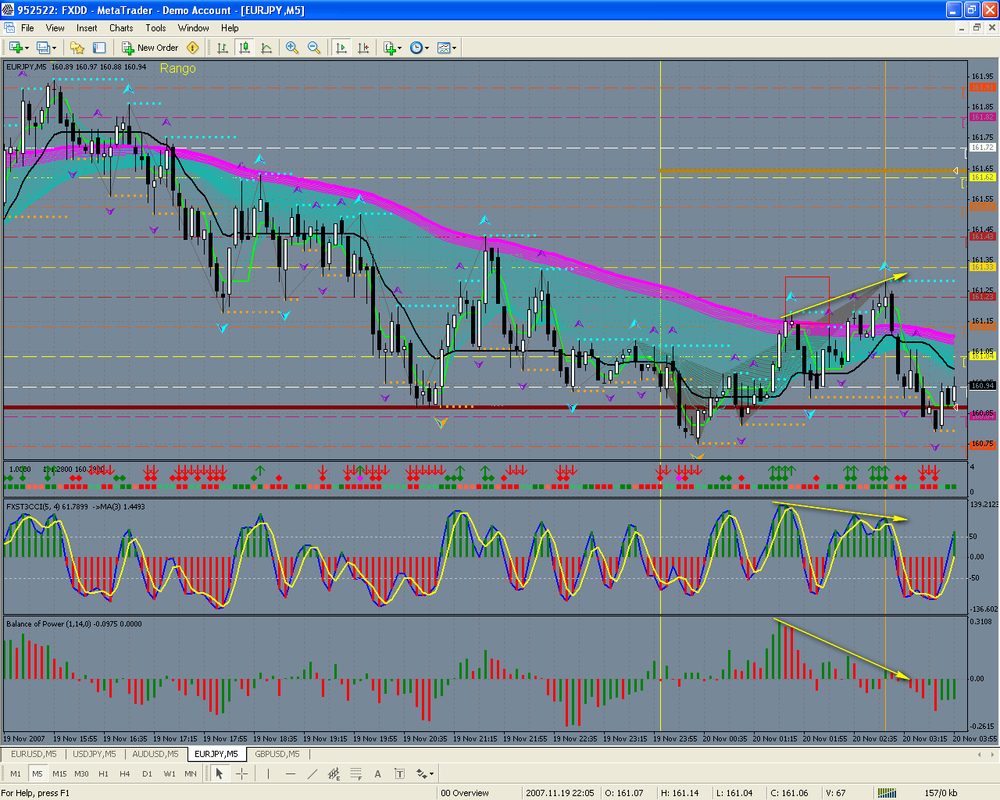
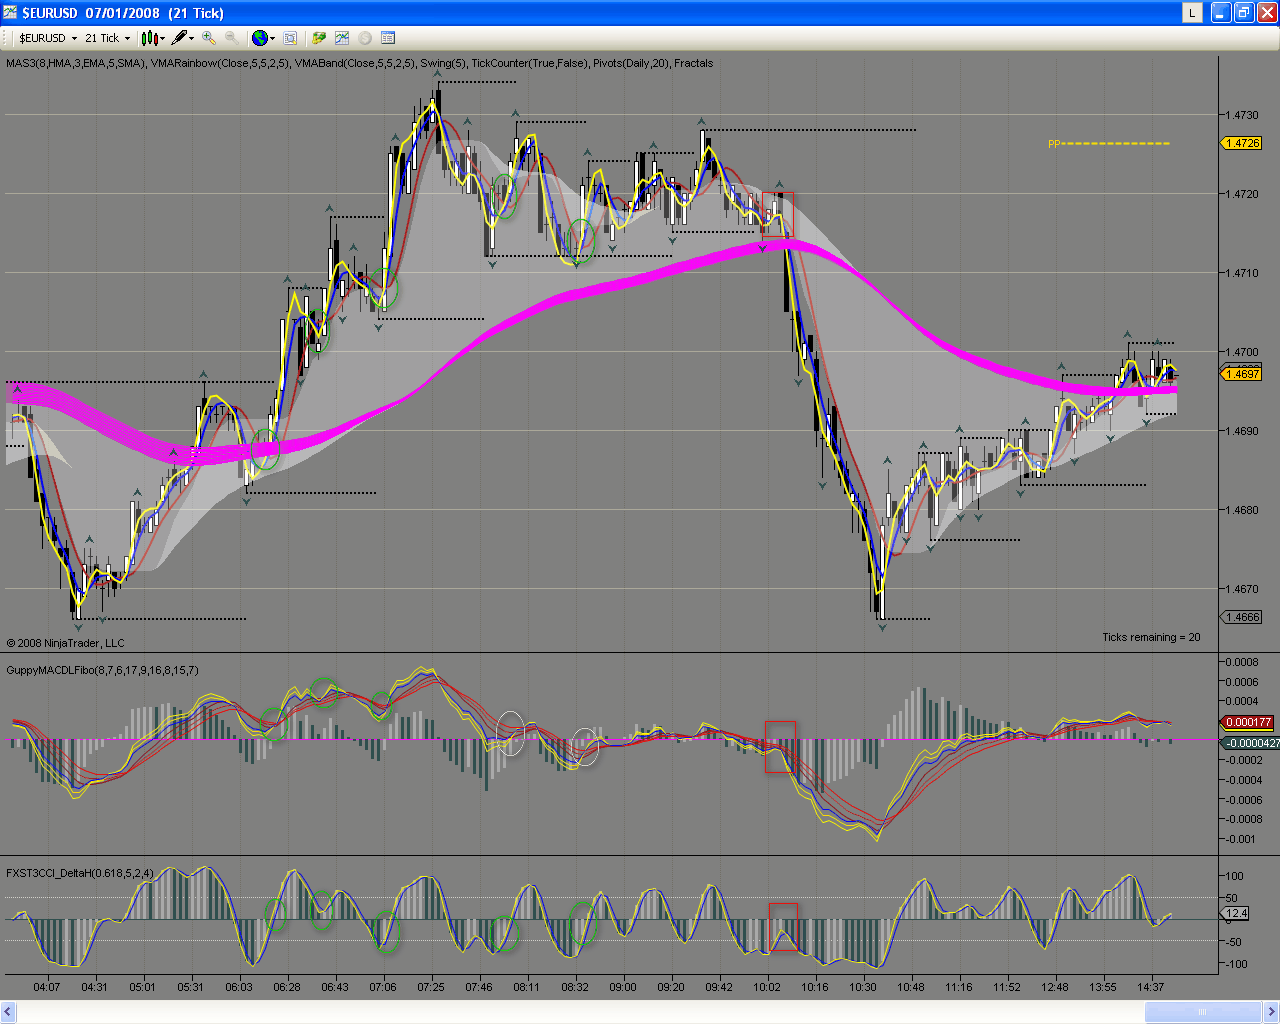
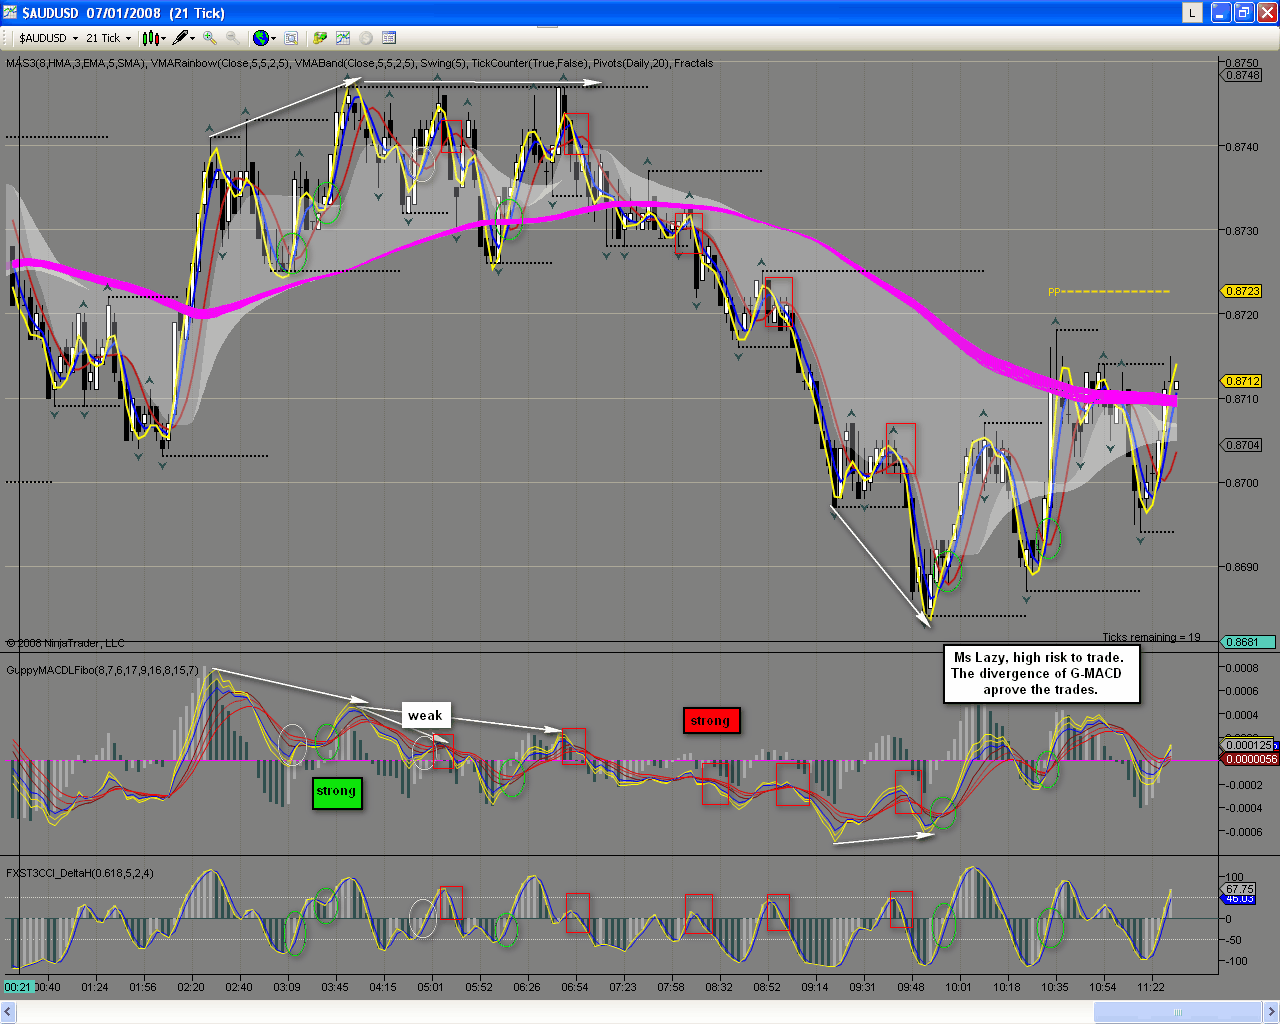
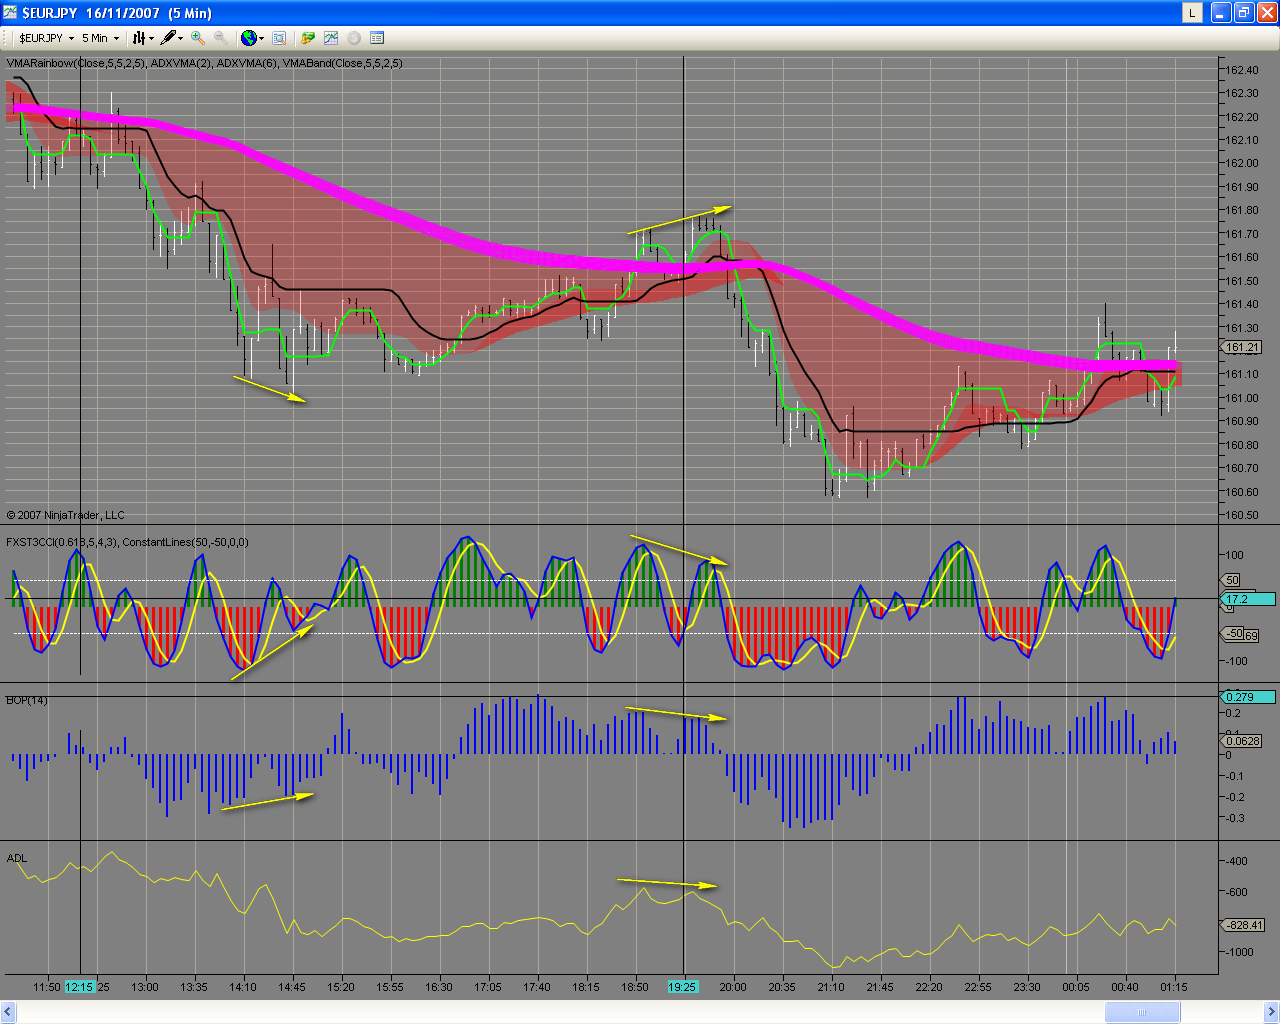
I am learning to use this indicator. I am not a master to use it. I am trying to substitute the indicator BoP used in the strategies of walterw. I am using it to detect divergences and also to filter the signals of the FXST3CCI indicator.
Walter suggested the signals of the waves of the FX Snipper that exceed the levels of 50 and -50, but besides to obtain the divergences with the G-MACD, my intention is to take waves of the FX Snipper that correspond to continuation, cases in the FXS does not exceed the levels 50 or -50, sometimes, it does not exceed the zero level.
I attached two charts in order to explain some basic uses with it. You can see there that but as it is, I believe that it is a good indicator that provides with much information, I do not know you who think about it... but remember, the most important always are the patterns, not the indicators....
Cheers.
Cattus
My best desires to all of you for this new year 2008.
I attach two charts with some signals.

-
2008 will be it, for now I will take some rest... happy holidays ¡¡ cheers Walter.More than deserved that rest, Walter. Thanks for all your great contributions! :thumbs up:
My better desires for this Christmas and the next New Year 2008, to you, to your family, to all the guys of Tokyo gang and finally, to all this great site of TL.
Happy holidays to all, buddies!!! :cheers:
Cattus
-
in YM at least, 22t its much smaller than 1 min... you will see what happens inside a 1 min bar, so very dificult to replace that Cattus, again you can trade from a 1 min chart but will be a diferent thing... cheers Walter.Cactus If you look at the charts Walter has posted you can count the bars per time unit and get a feel for how many bars per minute there are. IT looks like the 6T gives at least 15 or so and of course more when pace is greater.Cheers.
Thanks for your comments, Walter and BlowFish.
I had been thinking about it and now I am understanding better the utility of the tick charts.
I believe that the similarity on the EURJPY, between ticks (6 and 22) and minutes (1 and 5), is a coincidence, only that. And may be it is only on a precise hours of some days...
Cheers.
Cattus
-
I use tick charts for scalping, its like tape reading on a chart, you get to see whats happening... minute charts are more for longer trades, they give a very nice longer view of whats going on, so having both its very recomendable as they have difernt functions... cheers Walter.Well :hmmmm:, I think that I will need more practice with the tick charts in order to understand its use very clearly.
As I prefer to use MT4 instead of NT, and if 22t is more less equal to 5 min, and 6t is more less equal to 1 min, then I guess there not are to much differences between them in order to reach the same results that you usually talk in yours threads. :hmmmm: Well, I hope that I am right about it... :embarassed:
Thanks for your prompt response.
Saludos.
Cattus
-
Hi Walter! I hope that you are well.
I have some questions about the equivalence between the tick and minute charts.
I made a simple comparison between a tick charts and minutes charts in the EURJPY pair, and I found that there the 5 minutes chart is more less equivalent to the 22 tick chart, and the 1 minutes chart is more less equivalent to the 6 tick chart. But I suppose that it can be different depending on the volatility of the moment.
Do you have some equivalent similar to the one of my comparison? Why do you prefer to use tick charts insted minutes (or seconds) charts?
Cattus
-
Congratulations, Walter. I hope that you continue producing many more posts.
Thanks for your contributions.
Cattus
-
Hi guys.
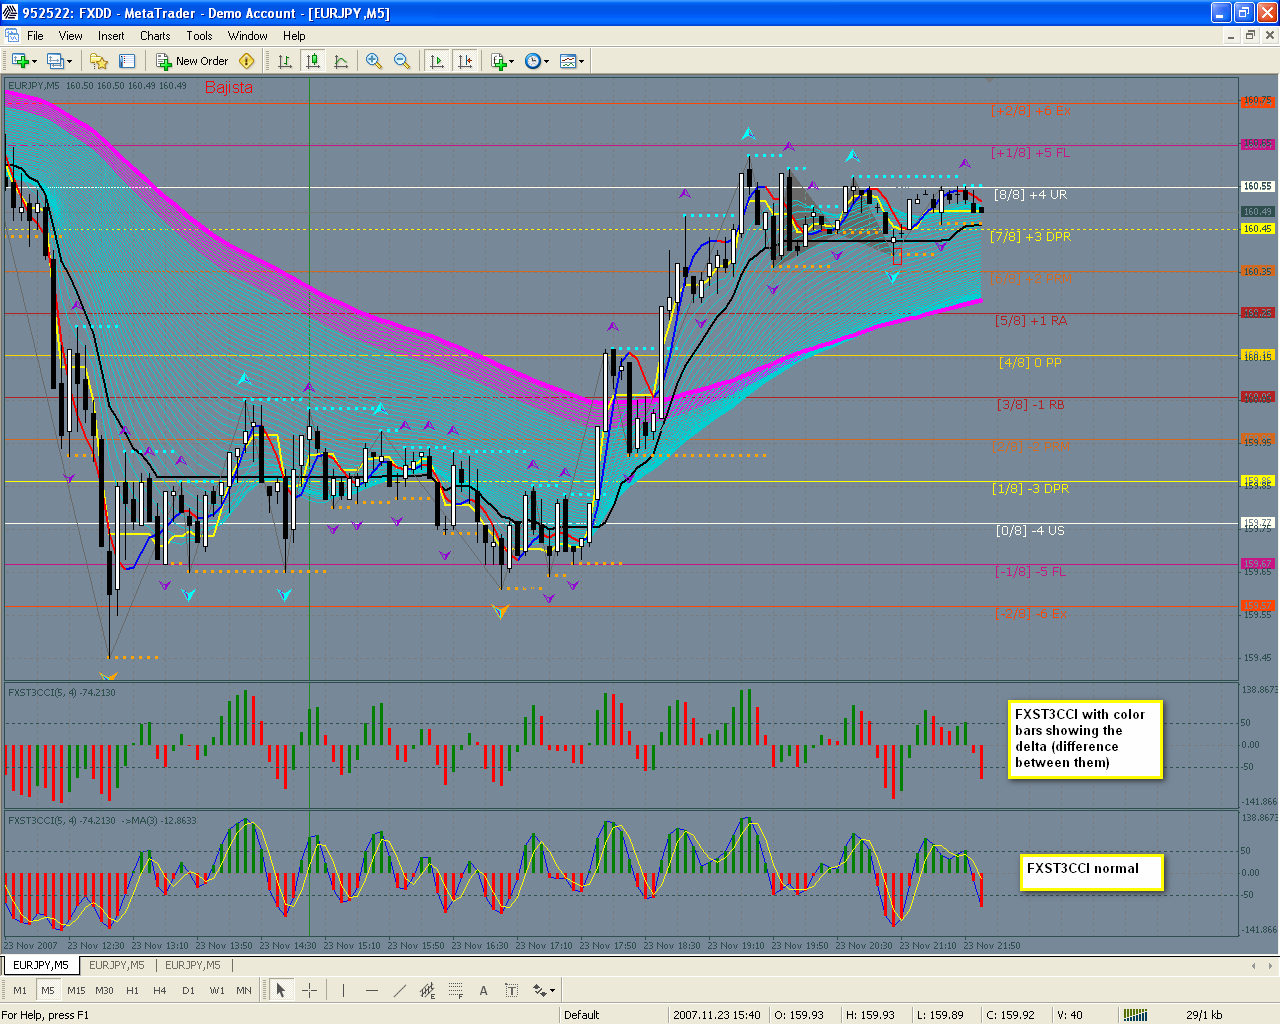
I attach a pic and a MT4 indicator of a personal version of FXST3CCI. I took the ideas that Igorad used with the BOP indicator an I made something like that with the FX Snipper (the bars are colored depend of the difference between them (delta)). I tested it yesterday and today and I found it works good.
I understand a little to code in MT4, but I am not a coder, then, if somebody see something wrong in this version, let me know it, pls.
May be some of you find this version useful...
Regards.
Cattus

-
Hi,Please try to test updated version of BoP with new value BOP_Mode:
0- original(Livshin's version)
1-advanced with a bit different formula:
BOP = (C - C[1])/(TrueHigh - TrueLow)
I think this formula should work more correctly(especially with gaps).
Regards,
Igor
Thanks again for your help, Igorad.
Cattus
-
Cattus, can you ask Igorad if you can share it with the TL gang ? he knows us, he did the very first vma code for us as well... cheers Walter.Sure, Walter. Let me try...
Cheers.
-
Hi sundowner.Do you have a subscription in the section elite of TSD forum? I asked there for someone that code the BOP indicator, and igorad did the indicator. I know that the code is very easy, but as I am not a coder I preferred that a coder make the indicators. The result is a good indicator because the igorad's version permit us to pre-smooth the indicator and to choose the kind of a moving average that we can use.
If you do not have the subscription, I would have to ask him to permit us the free use of that indicator.
Cheers.
AgustÃÂn
This is an example of the BOP indicator for MT4...
-
Thanks for the input Unicorn, nice looking charts.As you know I use metatrader, and if I understand correctly your divergence indicator does not translate. Trend line break ...very good idea.
Here's a trade I took this evening (Sunday about 6:00 pst)..if only they were all as stress free as this.
Thanks for your input this weekend guys. I appreciate it.
Have a nice week.
Regards
Sundowner;the BOP indicator can be ported just fine.
you can certainly type the code for BOP and have your own indicator.
cheers.
Unicorn.
Hi sundowner.
Do you have a subscription in the section elite of TSD forum? I asked there for someone that code the BOP indicator, and igorad did the indicator. I know that the code is very easy, but as I am not a coder I preferred that a coder make the indicators. The result is a good indicator because the igorad's version permit us to pre-smooth the indicator and to choose the kind of a moving average that we can use.
If you do not have the subscription, I would have to ask him to permit us the free use of that indicator.
Cheers.
AgustÃÂn
-
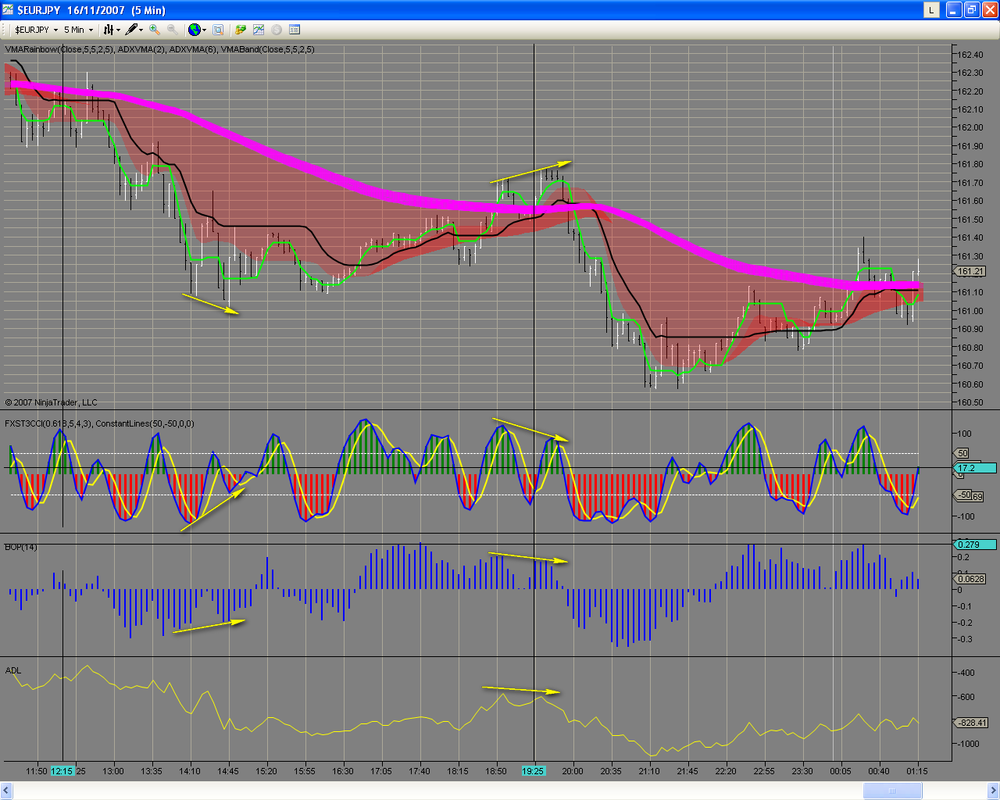
Hi Cattus;this is the accumulation_distribution Line, a summation of the value since the beginning of the chart. It is not the oscillator; that's why it does not require the 14 bar input.
It is also a different from the BOP based computation because it uses
((Close- Low) - (High - Close)) / (High - Low) * Volume
instead of
(Close- Open) / (High - Low) * Volume
regards.
Unicorn.
OK, Unicorn. I understand.
I tried to find some oscillator of Accumulation/Distribution in the forum of NT, but I did not find a example of them. May be other can help you.
Regards.
AgustÃÂn
-
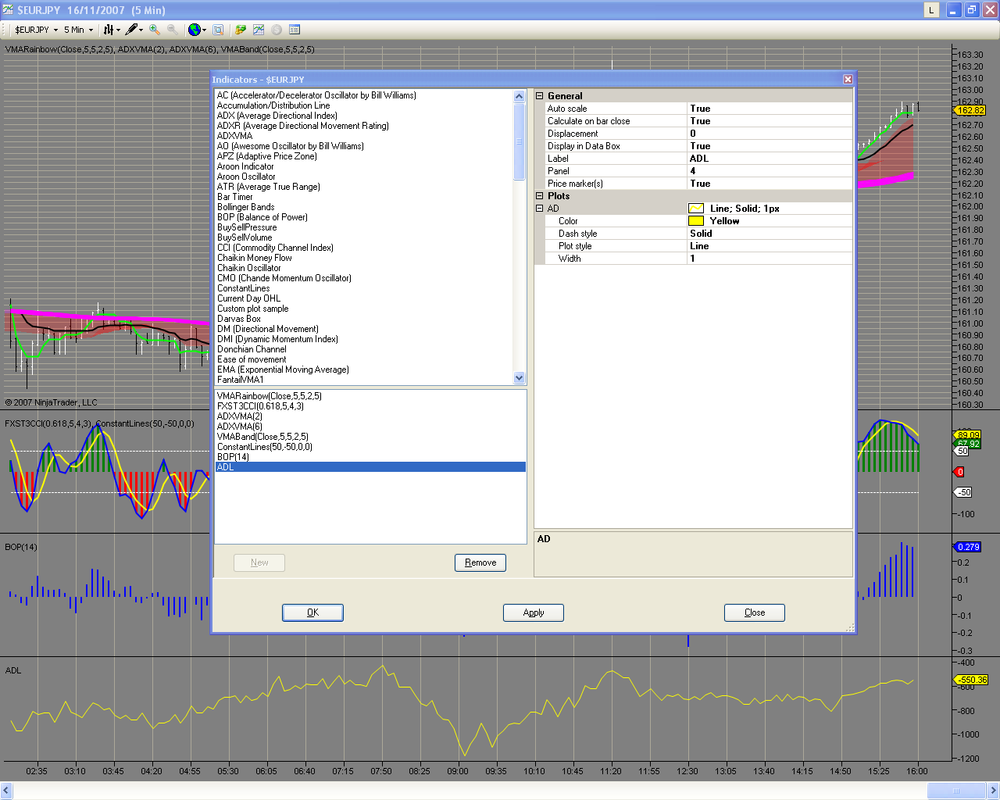
Yes Cattus, Thank you.is that the accumulation-distribution_oscillator(14) at the bottom (ADL)? it is usually shaped a lot more like the BOP; sometimes it shows a better divergence. Need more time evaluating it though.
I am not using NinjaTrader, but I do read the code, at least I understand it enough to notice the difference in indicator implementations.
Take care,
Unicorn.
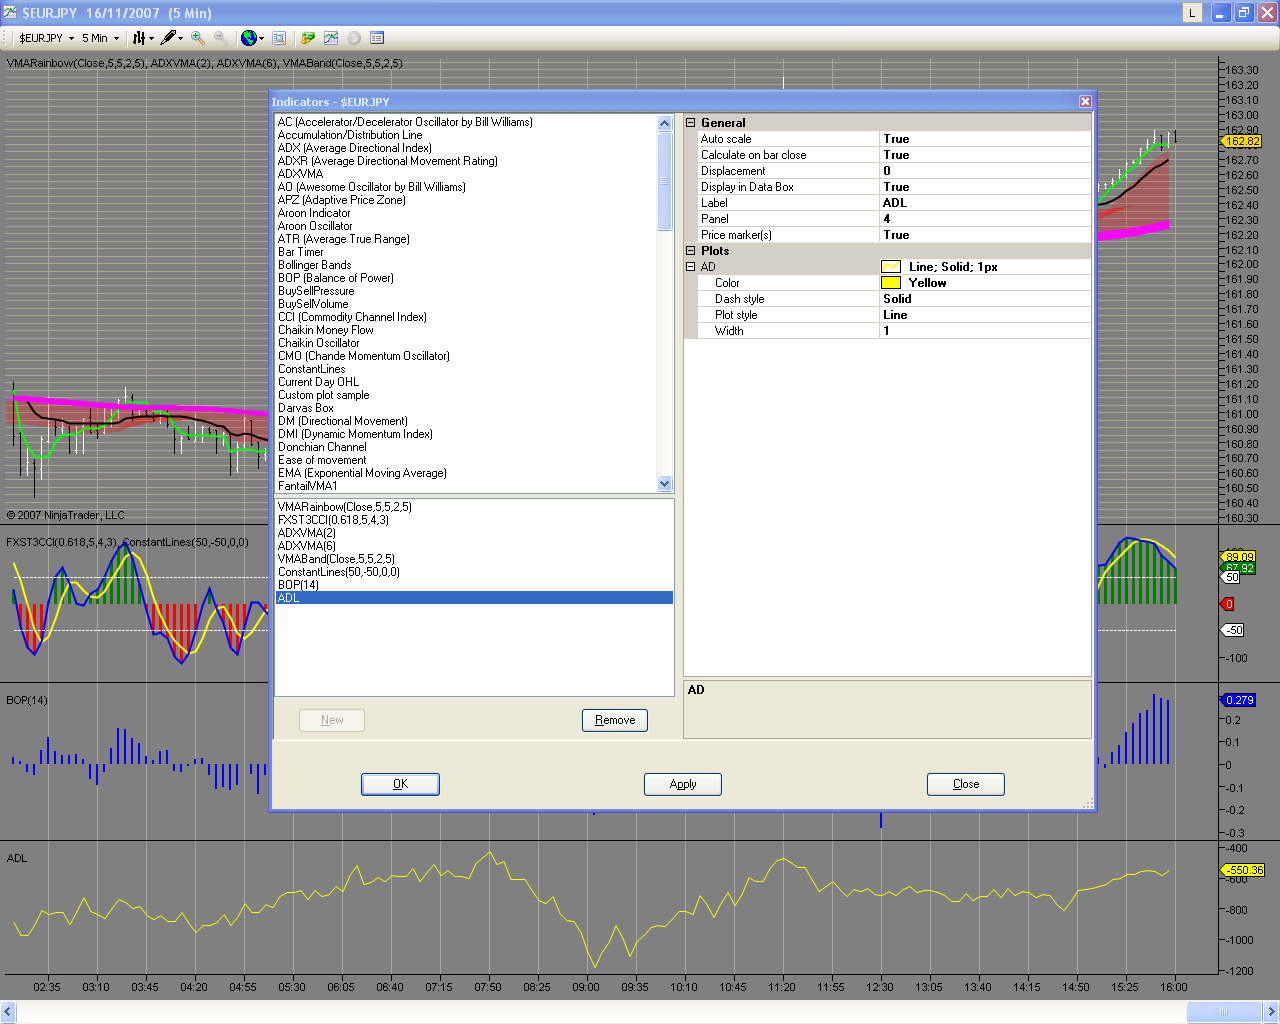
Hi Unicorn.
I attached a pic about the ADL box. And also, the text of the code. I can not find if the ADL is 14 or it have other number. May be you can distingue it better than me.
Cheers.
Cattus
-
Cattus : I DO trade centripetal trades, actually thats my expertise in futures, but I do it in a diferent graphic context, you may want to check this threads :http://www.traderslaboratory.com/forums/f34/the-false-break-trade-1994.html
http://www.traderslaboratory.com/forums/f34/the-lazy-trade-1942.html
Hi Walter.
I will read those threads.
Thanks.
AgustÃÂn
-
Walter, could you plot that as well on your charts, to compare which one is better for spotting divergence, the BOP indicator or the accumulation-distribution Oscillator? .Hi Unicorn.
Did you ask to Walter for this kind of example?
I think that would be great that you download the NinjaTrader, because with your knowledge you could help to evaluate this software...
Regards.
Cattus
-
Hi Walter, PYenner, Unicorn and sundouner.
Great interaction that you have here. It looks like a pretty game seen from the chairs of a stadium.
Hi Unicorn, thats precisely what I am working right now... taking some decisions into wich is the better combination of indicators... so I am letting the sands settle down and once I get the most simple and optimized combo I will make it public on a new thread... my idea is going live with that defined combination and be consistent posting my live trades during a year at least...So that thread will be diferent to the research threads as it will show something already defined and used on the live realm... it will be cool... cheers Walter.
Walter, already I am moved by this commentary, I will be waiting for this thread with anxieties....... I have some doubts as those that Unicorn mentioned...
...even I am still not convinced of using NT as it has data problems... cheers Walter.It is really a very important point... NinjaTrader has 3 forex sources of data and as I understand the confidence order of the data is: TradeStation, eSignal and the last could be data form Gain Capital. But to obtain any of them in order to work with live data as I understand we must pay for, or open a live account with TradeStation or Gain Capital...This condition make me think if it is better to compare NT with other chart packages like Amibroker, Ensign, or any other that have charts with ticks or seconds at least.
NinjaTrader has excellent capacities and also it allows to work with a different kind of markets, But I think it would be advisable to develop more this topic...
Regards.
AgustÃÂn
-
Hello Walter.
Your threads are excellent and very useful. I arrived late to read your threads and always I have the sensation that I am late with the reading of them, but even so, they have helped me to improve much my trading style.
Thank you very much to share your methods and efforts of investigation.
Saludos.
Cattus
-
Exactly. Having 10 pairs to make sense of is hard, when you get your wires crossed it hurts. Like you, I seek the reasons but I am only half way there, need to reduce the complexity before the trader can use it without shooting himself in the foot too easily.Exactly, it was an experiment done without stop losses to mess up the picture. It could only be done with a large demo account. It is unrealistic for a small live account, that is why it is not good to post those records. Thank you for understanding.
Bruce
Thank to you, Bruce. Good commentaries yours....
AgustÃÂn
Playing with the VMAR`s open research
in Forex
Posted
Hi Armand.
Do you have different versions of NT? If you have the beta version and the previous version, then you will have different folders to capture the indicators.
If you don't have the beta version, first try with it.
Cattus