
Welcome to the new Traders Laboratory! Please bear with us as we finish the migration over the next few days. If you find any issues, want to leave feedback, get in touch with us, or offer suggestions please post to the Support forum here.

ant
-
Content Count
435 -
Joined
-
Last visited
Posts posted by ant
-
-
Hi Kuokam,
You did well with your responses. Please note that you do not need to know Market Profile in order to answer these questions. The one question I would like you to think more about is, "how do short-term or day traders trade?" I would also like you to be a little more specific about the signs of long-term traders in the market. The key here is to get into the heads of your competitors, which is a requirement IMO, in order to differentiate between a market that is being dominated by shorter term traders vs longer term traders. I will provide a longer response later this weekend when I have a little more time.
But I will leave you with this, IMO, if you can develop the following 2 trader skills, I think you are well on your way to being a very profitable trader. The rub? These are arguably the most difficult things to do in trading, requiring quite a bit of experience to do it consistently well. You will never be perfect, but to make money in the markets, you don't have to be perfect. As traders, we continue to evolve and get better, but never perfect. There is more to trading than this, but these are key, because the answer to these questions get down to the basics of what moves a market.
- Determine who is dominating the market. (This is what this post is about.)
- Determine if there is an inventory imbalance.
- Determine who is dominating the market. (This is what this post is about.)
-
Hi Kuokam,
Let me ask you some questions first...
- What does a high confidence market look like to you?
- What does a low confidence market look like to you?
- If short-term traders are dominating the market, is that high or low confidence?
- If longer term traders are dominating the market, is that high or low confidence?
- What are signs of short-term traders in the market? If you're a short-term trader, than how do you trade?
- What are signs of long-term traders in the market?
I've talked about this in my other posts, so you can find some of these answers there. There is also information in the quote you referenced above.
- What does a high confidence market look like to you?
-
MP is simply a graphic that depicts the 2-way auction process. It is a bell curve (i.e., a distribution) that is used to organize the market data just like it is done in other disciplines. As such, MP allows us to gather market-generated information to help us interpret market behavior. MP is a tool - nothing more, nothing less - in your trading arsenal, but successful trading requires more than that.
isamel, the way you asked your question leads me to believe that you may be looking for exact rules for determining the participation of the various timeframes in the market from daily profiles alone. It's not that simple. You need to consider the longer timeframe charts, such as daily, weekly, and monthly, you need to consider market condition and trade location, and you need to consider market confidence like I alluded to in my previous post. With respect to the daily profiles themselves, you need to consider attempted direction, volume, value area placement and profile shape. And finally, just observe how the market is trading. This is where you develop experience reading the market. The market gives a lot of clues, if you're paying attention, but trading is still hard. There will always be ambiguity that creates doubt, but that is what creates opportunity. In short, you need to consider CONTEXT.
Let me give you an example of the type of complexity I am talking about. With respect to the profile graphic, what is the profile shape on a trend day where the longer timeframe may be involved? In general, the profile shape is thin and elongated. So does this mean that if we have an elongated profile that the OTF is dominating? No, it doesn't. If you have a profile that is elongated but too stretched out with multiple distributions and a lot of single prints, that is usually a sign of panic'd buying or selling - short-term traders. The longer timeframe doesn't trade this way. They like to see "backing and filling" so that they don't raise the prices on themselves, if buying, or lower the prices on themselves, if selling. So what does this portend for future trading sessions? A stretched out profile is considered "poor structure" and it is likely that the market will have to trade through that area again before the market can trade with confidence in a given direction. It doesn't have to happen on that day or even the following day. But that becomes background information (context) that you should not forget about. Also, when we trade through a stretched out profile, think about how swift the market may trade through it without any support or resistance. This is the informational edge that MP can provide. While most people see strength on a day like that, you're prepared for the opposite.
-
isamel, you're correct about the TPO count being used as a way to track inventory imbalances in the short-term (usually by the locals) when a market is balancing. TPO count is not as useful anymore, I don't know any traders that use it even though some Market Profile software still track it. Personally, I would learn the concept and move on. But identifying inventory imbalances is extremely useful in trading. Unfortunately, it takes a lot of time to learn and can get quite complicated since you can have inventory imbalances in different timeframes.
Regarding value, if the market opens above the previous day's value area, for example, and let's say 3 brackets or so have occurred above yesterday's value area, the odds are pretty good that the current day's value is going to be higher or overlapping-to-higher. If you trade value, you would probably be more aggressive on the long side. Your goal as a trader should be to assess the odds of certain things happening and then trading accordingly. Does value have to be higher on such a day? Not necessarily, the market could tank, but the more brackets we spend above yesterday's value area, the harder it gets to get unchange, overlapping-to-lower, or lower value. If it changes than we adjust our view of the market. You can also have a gap higher open, and the market auctions lower all day, but value is higher. What does that mean? That usually means that short-term the market is bearish, but longer term the market is bullish because the market is well bid, as they say. That is, if the market was truly weak, value would not be higher, buyers are still supporting the market, but perhaps the market got too long and needs to break before it moves higher (i.e., inventory imbalance). Learn to estimate value from the opening bell - very useful.
You can do a similar thing with day types, but don't get too hung up on the day type labels. Remember, the day types are used to determine whether the market is exhibiting high or low confidence. The labels are useful for learning about MP, but once you learn it you should really start thinking in terms of degrees of confidence. The same applies to opening types. Opening types really address the confidence in the market. This IS the point of day types and opening types. For example, on a trend day, the odds are low that we will revisit the opening price late in the day. can it happen? Sure, but remember, we're talking odds since no one can predict the market. As you can tell, the confidence level in the market is very important for determining trading tactics, at least for me. A high confidence open usually indicates the OTF in the market - fade less or not at all. A low confidence market usually indicates short-term traders in control - don't go for home runs. Discerning the dominant timeframe in the market is as important as it gets, IMO. Longer timeframes behave differently than shorter timeframes. Day traders love short-term references, like previous day's high/low. overnight high/low, opening, settlement price, etc. The longer term couldn't care less about those levels. They don't wait for markets to trade to these levels before buying or selling. Why? Because they can't afford to, they have too much business to transact when they're active. If you see the market trading through the open several times and to these exact levels and then reversing, that is a clue that the short timeframe is dominating. Sorry, I could go on, but I'll leave it here.
-
I disagree with your disagreement. You're playing a semantic game. Everything you do in life is a gamble. It doesn't get any better than putting the odds in your favor. What more do you need or want?You nailed it! Playing the odds is what profitable trading is all about. Most traders can't get past the current trade and try to do whatever it takes not to lose, which may develop bad habits for future trades. Having an edge and putting the odds in your favor is how professional traders survive the long-run (i.e., thousands of trades) and that's all that matters - not today and not the current trade. Profitable traders play the odds because they can't predict or control the markets.
-
Oh, and here is the 2008 market free-fall when the credit crisis hit. Sorry, I couldn't resist.

[ame=http://www.youtube.com/watch?v=nHBuKmyhbtQ&feature=related]Hardest song on piano ever! (Circus Galop) - YouTube[/ame]
-
Thanks for playing $5DAW, but I see it a little differently than you do.
This piece (Appassionata) is very fast and starts off with momentum and a high confidence opening like an open-drive. Entries are difficult, if you're waiting for a pullback. A minute into it the tempo is still quite fast! This market is one-timeframing higher (or lower, but let's assume higher) and this is showing signs of being a strong trend day. Most traders will wait for a pullback or pause for entry, but an aggressive entry would be to just get long while the market is trending higher early in the day and volume is still increasing, and then monitor for continuation, but most traders won't do this. Believe it or not, the risk is actually lower if you try to catch a trend move early on increasing volume, but it is counter-intuitive to most. But let's assume that you don't initiate a trade this way because it doesn't suit your style, that's fine. So where can we initiate a trade with a more conservative entry? Well, let's wait for the pullback or pause. And what do you know, as fast as this market (or piece) is, the first pullback or pause starts 2:30 and ends at 2:55, after that, you missed the entry and the market is off again. Your first potential long was no later than 2:55, but the market has already been moving up without you. So now what do you do? Well, I can tell you, do not fade this market, whatever you do, don't fade this market, because it can end the day on near its high given the way it's moving. And if you did get long early in the day, this is an easy day for you. You want to hold this trade until the end of the day, if possible, and add to your long position on pullbacks. The previous pullback/pause was a good place to add to your long. On a trend day up, the market usually encounters an inventory imbalance in the afternoon when the market gets too long (i.e., an inventory imbalance to the upside). So what does it do? Well, it has to correct that imbalance before it can move higher. That inventory correction came in the form of another pullback that started at 5:00 and ended at 5:32. This is a high probability trade on a trend day (i.e., the inventory correction that normally ensues). That is your second long opportunity. After 5:32, the market resumes the trend. And then towards the end of the day, everyone is now seeing the trend and all the momentum traders are jumping on board. And we start to get a huge bar, a spike, starting at 7:09 and it indeed ends with a climax. So what do you do now? Sell and take your profits, the tempo at the end of the piece is too fast, and unsustainable, this is a spike and a "gift" from the market. You want to see good tempo, but you don't want tempo that is too fast. That is usually the sign of forcing action like long liquidation or short covering.
So if the Appassionata is a fast tempo piece indicating a strong trend day, what would be a more rotational type of day. Well consider the following piece instead. This for me is more of what $5DAW described in his post - a rotational day. This is Beethoven's Pathetique (2nd Movement of Sonata). Can you hear the difference?
[ame=http://www.youtube.com/watch?v=n2nG1bt7IBM]Freddy kempf - Pathetique Mov 2 - YouTube[/ame]
-
Feeling the market tempo is extremely helpful in trading, although this concept may be a bit hard to understand. For those trying to understand what tempo means, try relating it to music, where tempo plays an important role. Below is a video of a pianist playing Beethoven's Appassionata (3rd Movement of Sonata). What type of day would this be and where would you initiate a trade based on the tempo of this piece? It's Friday and I'm just having fun with this. Enjoy and have a great weekend!
[ame=http://www.youtube.com/watch?v=xz7usUEPWsc](In HD) Beethoven Sonata Op 57 "Appassionata" Mov3 - YouTube[/ame]
-
The Market Profile graphic captures the auction market process by organizing the data and allowing one to assess Price, Time, and Volume. Any market that is financial in nature responds to those three components. The volume and TPO profiles both have their place in market analysis - one measures volume and the other measures time. Volume and time together define value. To read the market, both are useful and I use them both throughout the day. I use Market Profile heavily as part of my trading and it is still an effective trading tool that provides me with more information than traditional charts. But as a trader, I use bar charts too because it gives me a bigger perspective by allowing me to see more price data in the chart. I agree with previous posters that Market Profile is not a system. It is a tool for understanding market behavior. However, it appears that most traders use it to trade off of, like fading the value area and single prints, which is far easier than using it for its intended purpose. I believe that most successful traders intuitively understand how markets/auctions work whether they use the profile or not, but the profile does a very good job of capturing the auction process. Using profile shape, value area placement, and volume with the attempted direction is incredibly useful for assessing market confidence, monitoring a trade for continuation and determining who is dominating the market on a given day. When short-term traders dominate the market, traditional technical analysis will work a lot better because the dominant timeframe uses technical analysis themselves. But if the longer timeframe is dominating the market, that's another story. The longer timeframe does not care about day timeframe references, and the longer timeframe will always trump the shorter timeframes. It's quite empowering as a trader to understand what the market is doing many times and then waiting for good trade location to align yourself with the market context.
-
Hi Idetsc,
I won't provide any stats, but will tell you that that is an area worth researching on your own. All the best with your trading!
Antonio
-
Slight correction... The T&S shows trades that have occurred and at what price. A trade does not always have to occur at the "visible" bid/ask. You could have $22.10 bid x $22.15 ask and have a trade tick off on the T&S at $22.13. A complete T&S will also show all bid/ask price and size changes as well.Jason
Yes, the trade can occur in between bid and ask. I was just trying to keep it simple.
-
I just remembered... no one answered why the times and sales does not show both sides to the trade. If there is a buyer for every seller, how can there be a buy of 1 in the T&S without a sell of 1?T&S shows trades that have occurred and whether they occurred at the bid or ask price. Each trade requires a buyer and seller. How can someone buy without a seller or how can someone sell without a buyer? For a trade to occur, either the buyer or seller has to go to the market.
-
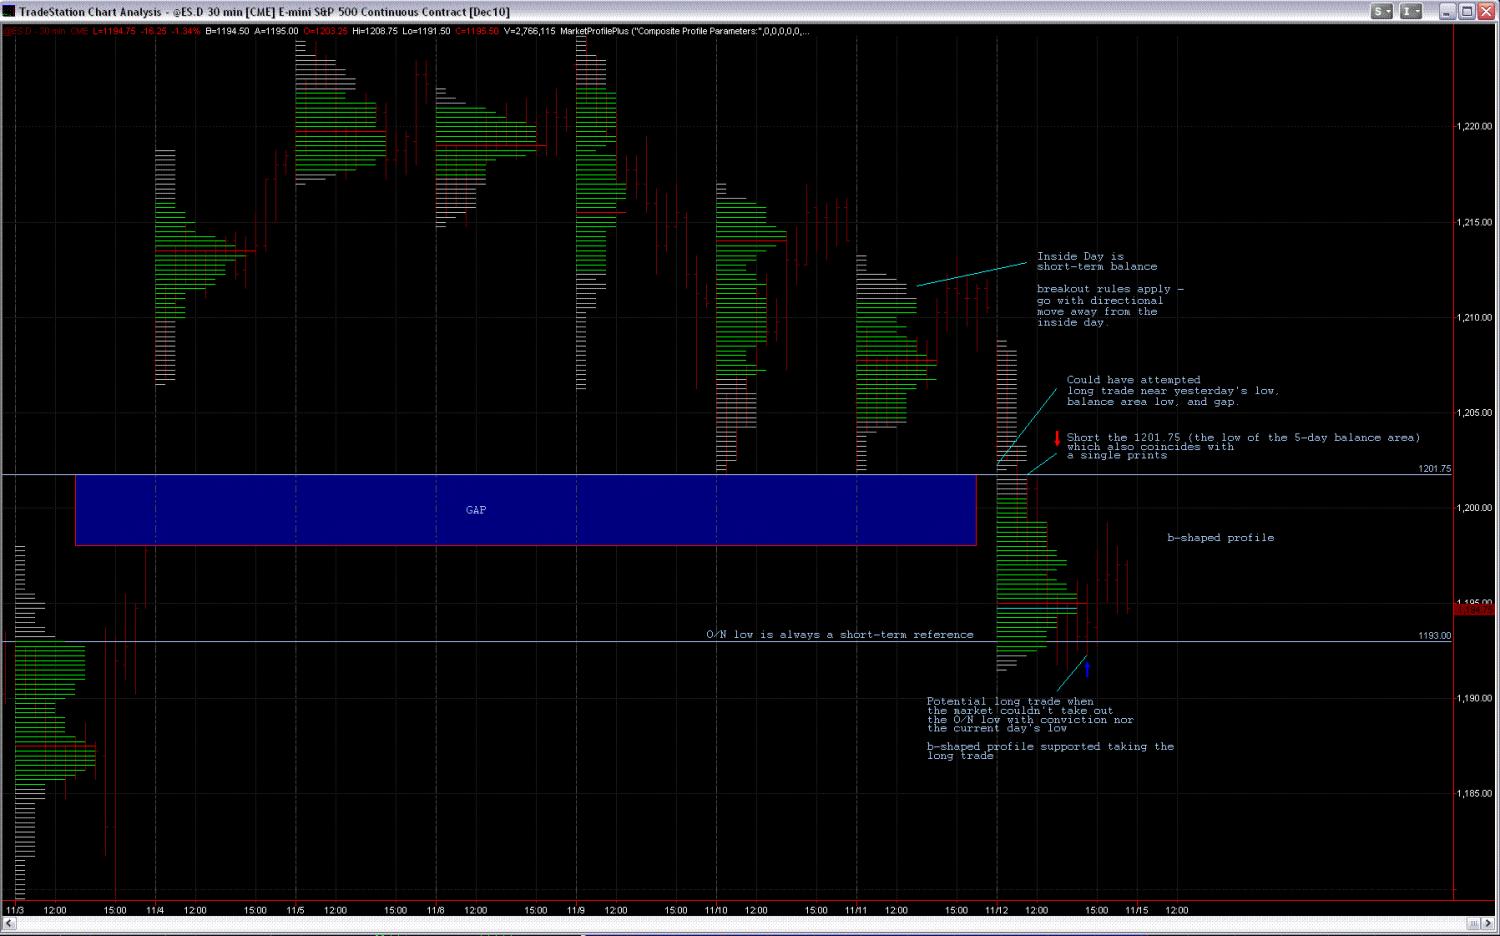
If the market opens within value...
- I would consider going short at the rally high with the expectation of the prominent POC and poor low being revisited. Staying below the rally high keeps the short-term downtrend intact.
- I would consider going long in the 1191-1193 area, which covers Friday's poor low, the previous balance area high at 1193, and the lower trendline. Also keeping in mind that Friday's profile was b-shaped. I would really like to get a peek-a-boo below Friday's low to see if there are any more sellers and to correct the poor low.
Here were potential overnight trades based on the above analysis. Note that these were discussed for the regular trading hours, but if they set up overnight, they are still valid trades. Overnight session opened within Friday's value area.
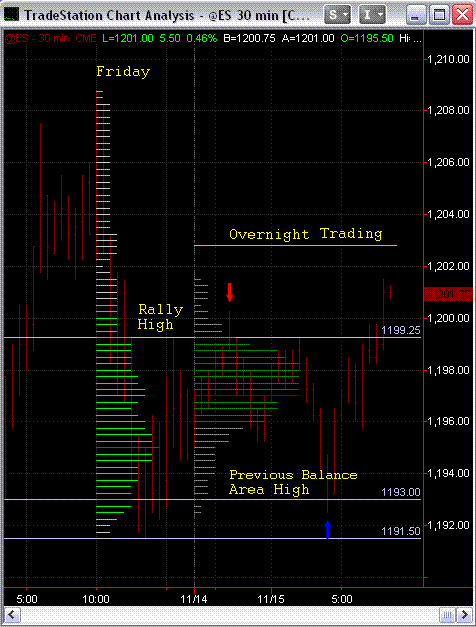
- I would consider going short at the rally high with the expectation of the prominent POC and poor low being revisited. Staying below the rally high keeps the short-term downtrend intact.
-
I agree with much of what Steve has written in this thread, but I'd like to add the following. I agree that the "big players" or longer term traders/investors don't care much about the reference levels that most traders use. But for me, reviewing longer term bar charts, reviewing Market Profile, and applying market logic is an effort to understand what is happening in the market so that I can try to align myself with the dominant player. That is, who is dominating the market on any given day, short-term traders, longer term traders, or both? Whoever the dominant player is, I want to play their game. On those rotational type days, where the market is being dominated by short-term traders, "good" reference levels tend to hold. But when the market is being dominated by longer term traders, those same reference levels get mowed over many times. This is why context is so important in trading and helps with determining trading tactics and devising one's trading plan for the day. This is where my trading edge is - understanding market behavior and adapting to the current market behavior. Am I always right? Of course not.
Longer term bar charts and Market Profile provide me with a roadmap as to what is the market condition, who is dominating the market on any given day, where are the longer term traders/investor likely to enter the market, whether inventory is getting too long or too short, where the "destination trades" might go, etc. I always, always, always want to align myself with the longer term players above anything else. Otherwise, I'll play the short-term trading game. And yes, all timeframes are usually in the market on any day, but the question becomes to what degree. In general, I want to align myself with the "big players" and fade the retail trader.
IMO, identifying the different timeframes in the market is critical for traders to succeed over the long-term, but it's tough to learn and requires a lot of experience. Reference levels alone do not give an edge, although this is where most newbies focus their efforts because it is easy to learn, again IMO. I'm a strong believer that if you want to fail at trading, just do what everyone else is doing. It's logical if 90% or so of traders fail. Traders usually come up with similar reference levels using different approaches (i.e., Fibs, PP, moving averages, Market Profile, etc.) and blindly fade them without considering market context. Good luck with that! Much of trading success also has to do with trader feel and considering market tempo and the confidence in the market. My trading framework, influenced mostly by Dalton and Wyckoff, has done well in putting me on the right side of the market on most days that I trade. After that, it's a matter of playing the odds of how the market may play out given my interpretation of what the market is doing in the timeframe that I am trading. And, trying to find good trades with good trade location and excellent risk/reward.
I'm sure others will disagree with me, but hey, that's what makes a market. Thus far, this is where my journey has taken me. As I gain more trading experience, some of my assumptions will change, but I don't expect [hope] that my framework will change much. Sorry if this post comes off like a lecture, I just have confidence in what I do, and that tends to come out in my writing. I respect all differing viewpoints and enjoy reading them, which is why I still visit trading forums.
-
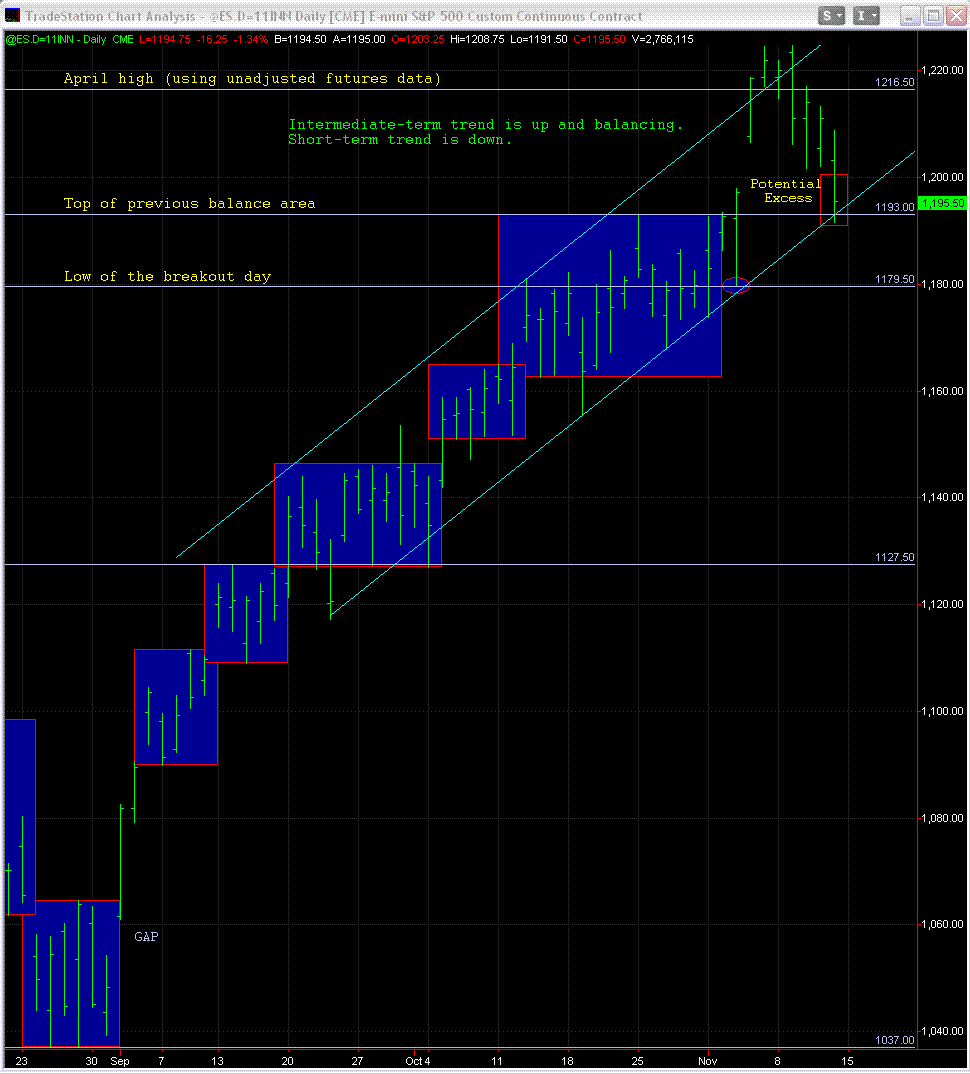
I thought I'd share my analysis for Monday, 11/15, to continue this discussion on price discovery and reference levels going. Here it goes...
The following is a daily chart of the ES. It shows the ES trading near the top of the previous balance area (1193) and Friday's potential excess.
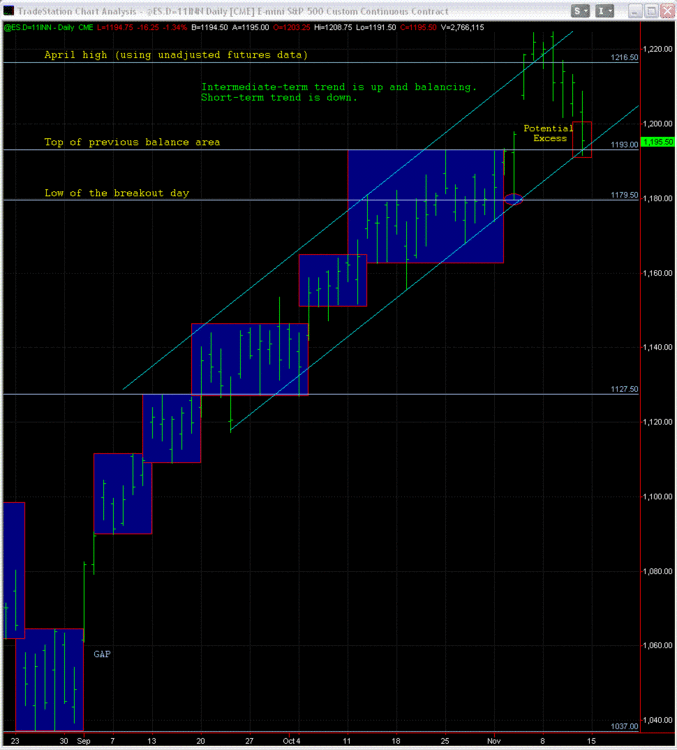
The next chart shows the previous two balance areas with important reference areas. Note that I have not included Friday's trading in the most recent balance area since it closed outside the balance area. However, if the ES starts trading back into the balance area (above 1202) next week, I will consider it part of the balance area (i.e., Friday will have extended the balance area) and Friday will most likely be considered excess with a new up auction beginning. The chart also shows a b-shaped profile for Friday's trading indicating that trade is not being facilitated lower. The POC was 9 TPOs wide, which I consider to be prominent, which means that it could get revisited on Monday.
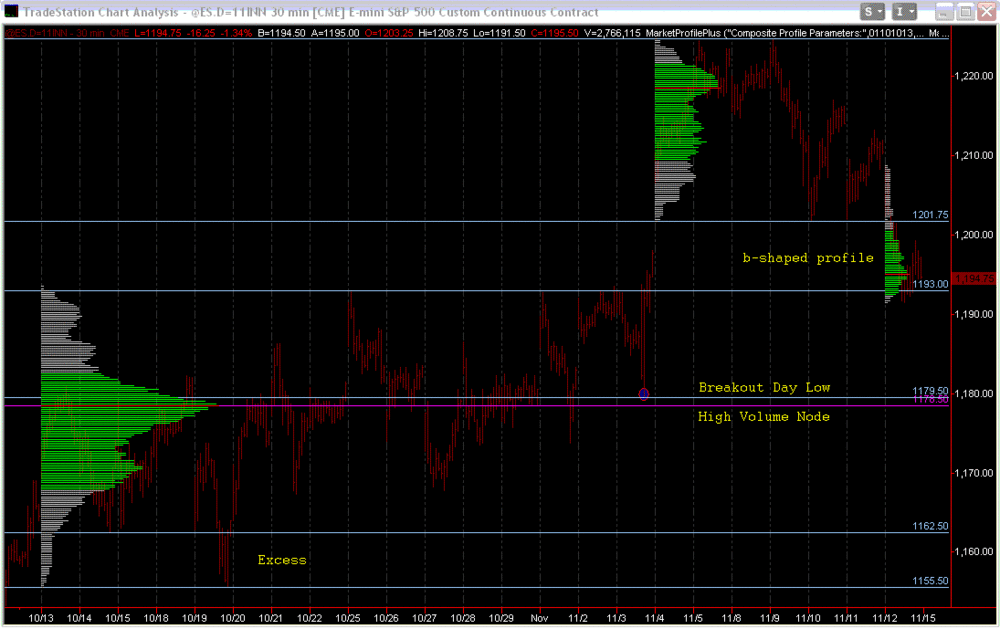
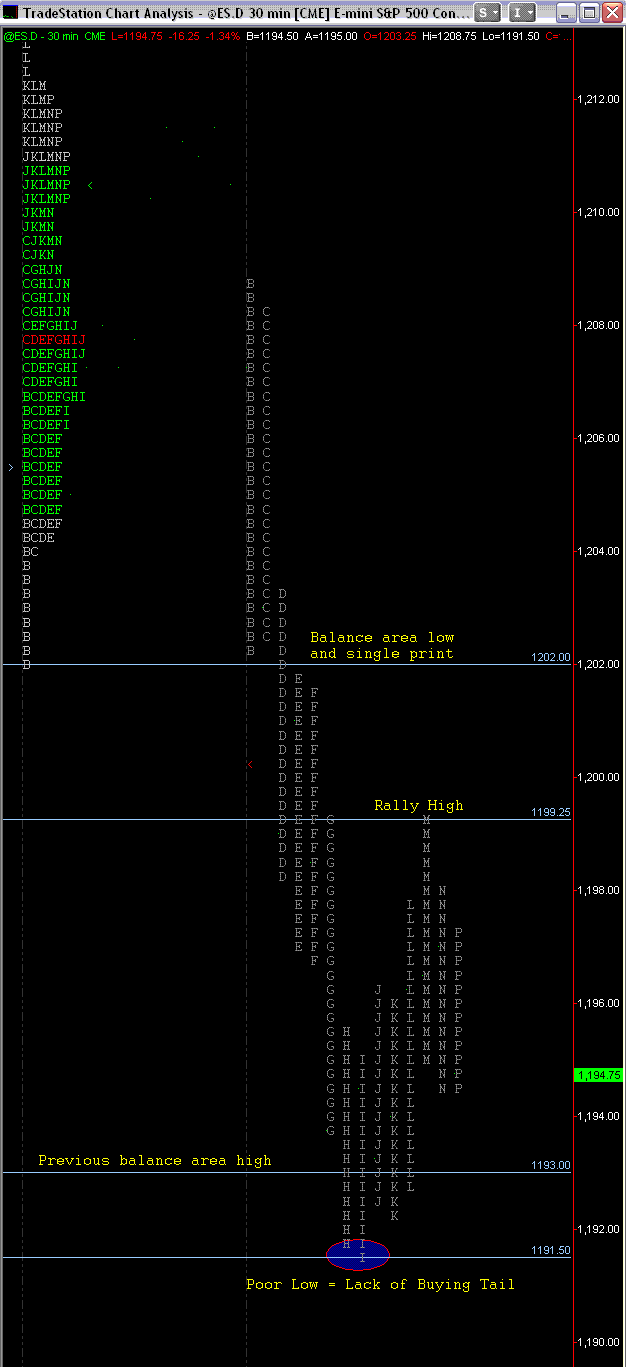
The final chart looks at Friday's trading in more detail. It highlights the rally high, single print, and poor low.

Here are my potential trade scenarios for Monday:
If the market opens within value...
- I would consider going short at the rally high with the expectation of the prominent POC and poor low being revisited. Staying below the rally high keeps the short-term downtrend intact.
- I would consider going long in the 1191-1193 area, which covers Friday's poor low, the previous balance area high at 1193, and the lower trendline. Also keeping in mind that Friday's profile was b-shaped. I would really like to get a peek-a-boo below Friday's low to see if there are any more sellers and to correct the poor low.
If price is accepted below the 1991-1193 area, I would look for a short entry since it opens the possibility of trading to the opposite end of the balance area.
If price is accepted above the rally high and single, I would look for a long entry since that would confirm that Friday as being excess, which I would consider to be the start of an up auction. Once we start trading into the most recent balance area, the market may take a shot at the most recent highs over the next few days.
Once in a trade, I will use all the other reference areas to scale, manage the trade, and enter new positions. Also, prior to the market open on Monday, I will review the O/N trading, observe where the market will open, and the monitor the confidence level at the opening. I will then review my trading plan once again. Note that I try to put together a story to support a trade. I usually do not use a single data point to justify a trade, but I do have a few exceptions.
- I would consider going short at the rally high with the expectation of the prominent POC and poor low being revisited. Staying below the rally high keeps the short-term downtrend intact.
-
Ant,
Are you considering each box a period of auction, and "excess" is similar to what Steve46 calls "offset supply?
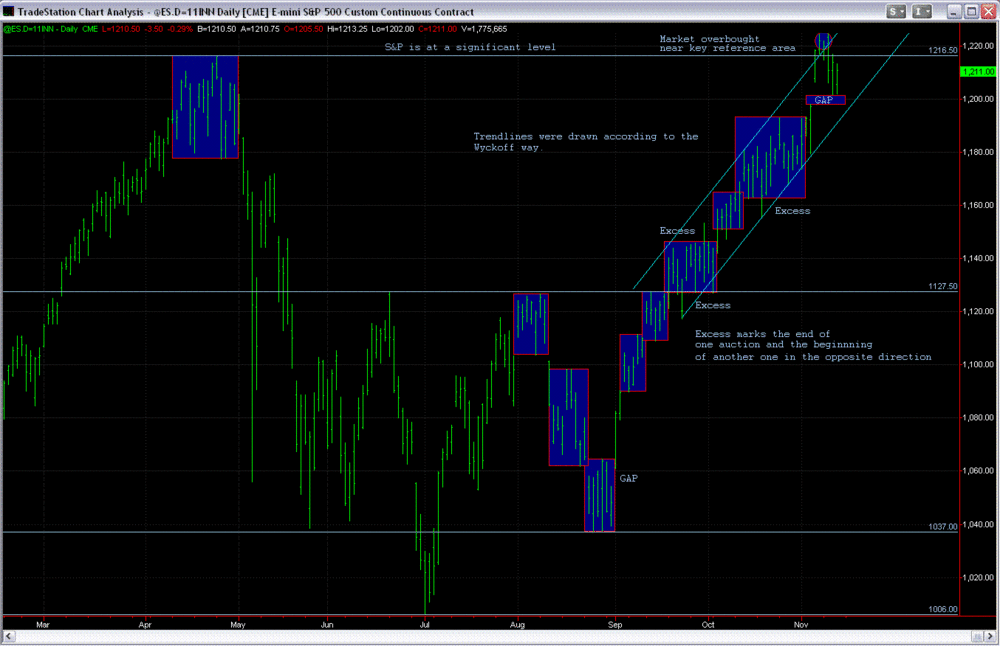
Snowbird, I view the markets in terms of brackets, breakouts, and trends. It's how my trading mind works. When I first started trading, I used to view the markets as a momentum trader and only focused on trends and pullbacks. Anyway, each "box" in my chart is a trading range. While in a trading range, I look to fade the extremes, generally speaking. Excess usually marks the end of an auction and the beginning of a new auction in the opposite direction. So yes, that is an area where supply/demand came in. Auctions don't have to end with excess, volume can simply dry up in the current auction. But as you can see, up/down auctions usually end with excess. As Dalton says, excess and balance are probably the two most important concepts that MP traders deal with. When I draw the "box" around a balance area, I try to let the excess stick out of the "box" to remind me that the auction might be over. Eventually, the market will break out and auction higher or lower until two-sided trading is found. It can also fail to breakout and re-enter a previous balance area. This is one of my favorite trades because the risk/reward is usually excellent. The market condition (balance, breakout, trend) helps me determine my trading tactics for the day. But as a trader, if the market starts to do something different than I expected, I have to adjust my thinking - not easy to do obviously. IMO, to have a chance at succeeding at trading, a trader should have a model by which (s)he frames out the market that is based on sound principles. This is mine. Hope this helps.
-
Would be interesting at end of day for you to take a look and recap how it reacted around those key levels if you can.MMS
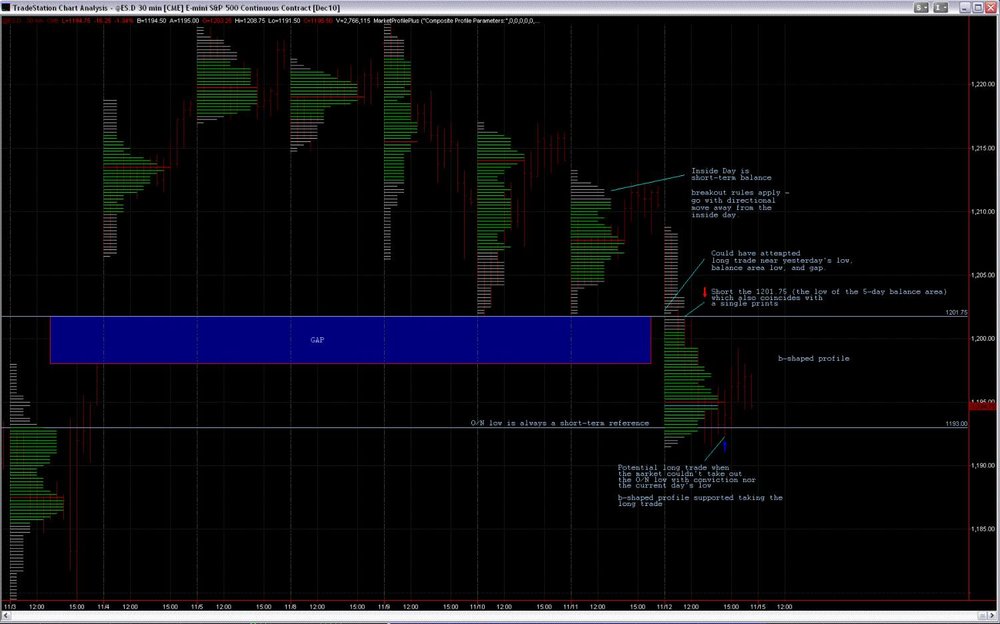
See figure below for potential trades today. One thing worth mentioning is that context is important to consider along with the reference levels.
-
bojangle,
Below is a daily and 30min chart of the ES and the type of reference areas that I mark off everyday. I think my view of the market is self explanatory from the charts so I won't add any more text. Hope this helps.

-
Increase your timeframe and observe longer term (more reliable) references. These are the references where multiple timeframes get involved, not just day traders. Translation: Bigger Opportunities.
-
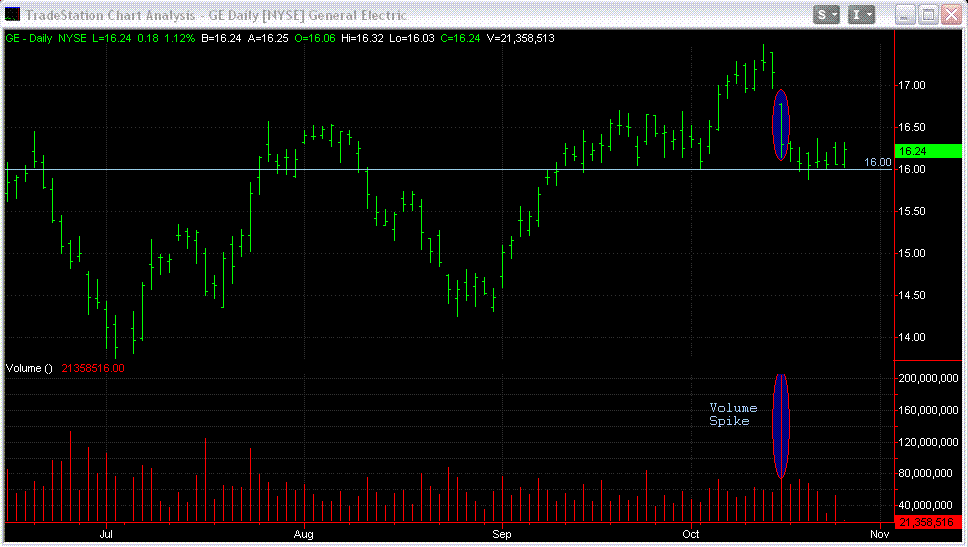
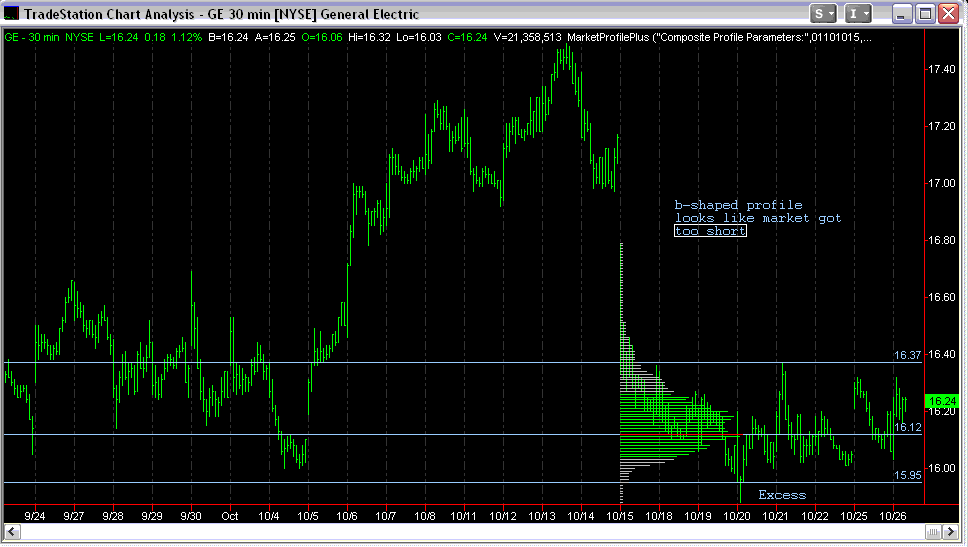
catsrevenge,
I'm assuming that you normally trade this size so a $28K loss is not out of the ordinary for you when you have a losing trade. I could be wrong. You asked for an opinion, so here's mine. In my opinion, I would hold GE a little longer as it appears to be oversold right now.
The first chart shows a volume spike and the second chart shows a b-formation on a market profile chart. Both charts indicate that traders/investors got too short on GE. In addition, you can see excess at the low in the MP chart, which indicates the start of an up auction. I would put my stop just below the recent lows (below the excess), but GE needs to get above 16.37, if it's going higher. If GE pops a little, I would exit as GE trades towards the gap and not be greedy.
This is obviously your decision and your trade, but I gave you my opinion anyway. Good luck!
-
There is a good article at Futures Charting that discusses when to use adjusted vs unadjusted futures data. Basically, the conclusions of that article are:
- Use unadjusted futures data for trading based on past support/resistance levels. Unadjusted futures data keeps the price action pure (i.e., price levels are only changed by the market itself not by adjustments made to address the gaps during rollover).
- Use adjusted futures data when back-testing or using technical indicators, like moving averages, because of distortions caused by gaps during the rollover.
FYI: For those using TradeStation, the symbol for adjusted data is preceded by @ (e.g., @SP.P) and the symbol for unadjusted data would be in the format of @SP.P=108xn.
Another interesting observation made by the author of the article is that the gap caused by rollover, as seen in a chart with unadjusted prices, are often viewed by traders as normal gaps and are usually filled. Something to watch...
- Use unadjusted futures data for trading based on past support/resistance levels. Unadjusted futures data keeps the price action pure (i.e., price levels are only changed by the market itself not by adjustments made to address the gaps during rollover).
-
When looking at past futures data (years earlier), do you use unadjusted or back-adjusted futures data? Which futures data series do you use for longer-term trading or when specifically looking at past highs/lows, pivot highs/lows, and gaps on a chart, not for applying indicators such as moving averages, etc.? Depending on the data series that a trader uses, this could have an impact in a trader's analysis when using Wyckoff and Market Profile based principles.
Here's an example. The following chart is of the S&P pit contract using back-adjusted data due to rollover. Notice that the all-time high is 1759.90.
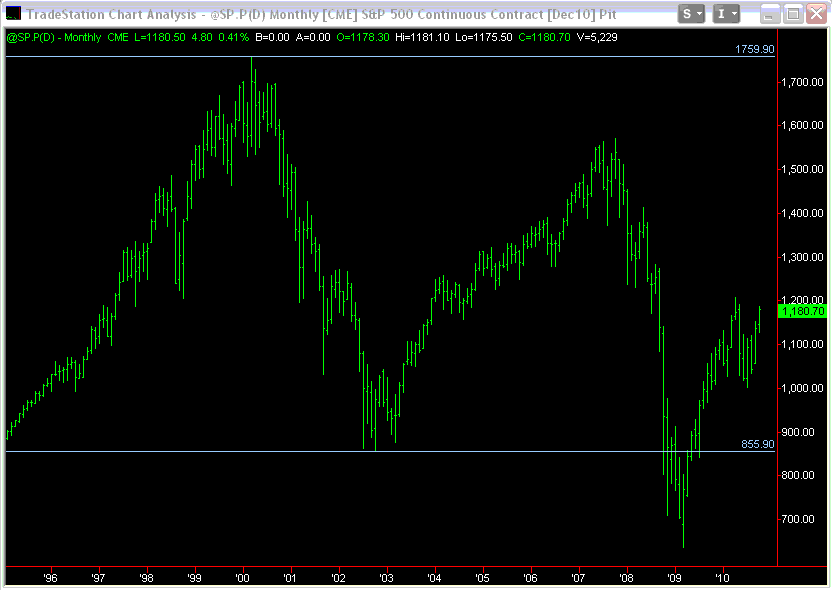
The next chart is of the S&P pit contract using unadjusted data. Notice that the all-time high is 1574.
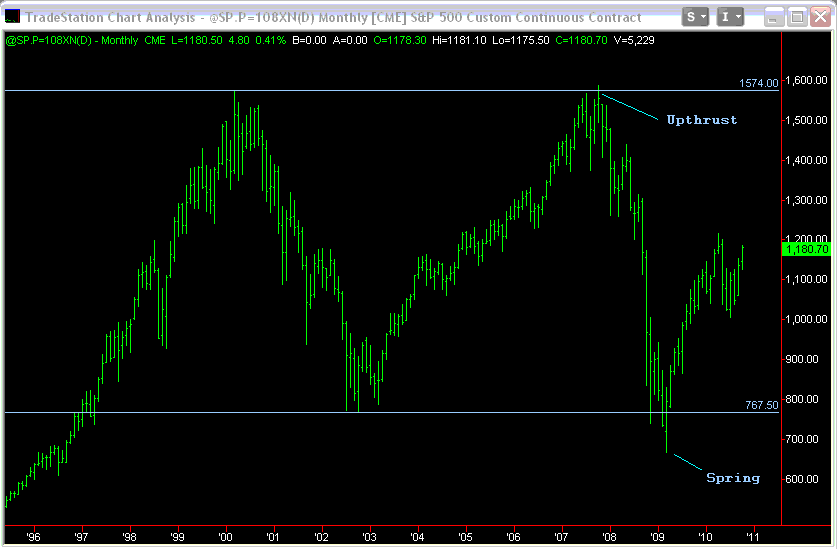
From a Wyckoff perspective, a trader can say that there was an Upthrust in the second chart because it tried to breakout from the bracket above all-time highs and failed (i.e., returned back to the bracket). Conversely, at the bottom of the bracket, a trader can say that there was a Spring. This analysis could not be made if back-adjusted data were used.
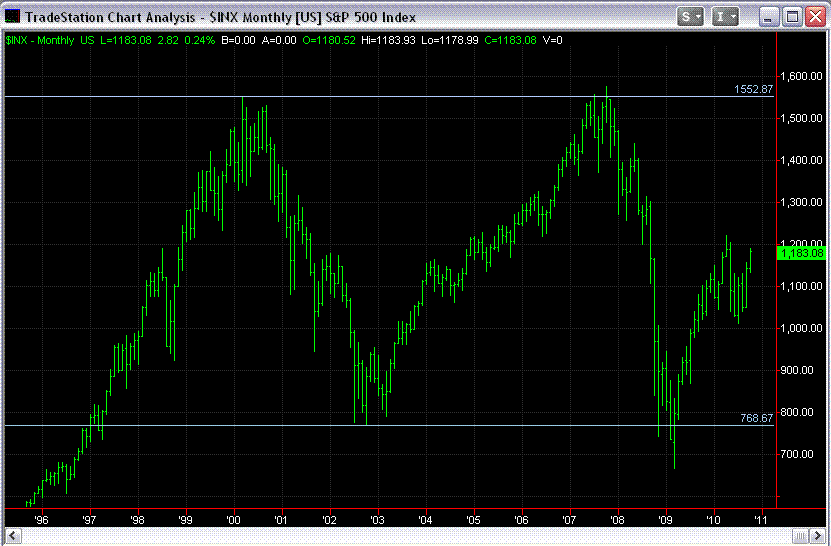
The following chart is of the S&P cash index. This data seems to corroborate that using unadjusted futures data is the correct data series to use when performing a market analysis as described in my example above. Personally, I've been using unadjusted futures data, but I've seen traders using both data series for their analysis, including trading educators. What do you think?
-
Chouca,
When a market is too long and can't get through a high, for example, you can usually feel the anxiety of the traders that are long. Every time the market reaches the high, some traders sell (take profits) - everyone that wants to be long has already bought. There just isn't enough buyers out there to lift the market at those prices. Eventually the market will go up one time too many and long traders will go for the exit causing long liquidation. Prior to that, the market chops around the high so the cumulative delta would not be extreme, I think. So it's not so much the other timeframe creating supply but the anxiety of nervous traders (weak hands). Once the imbalance is corrected the market heads back up. And remember that long liquidation strengthens a market because it gets rid of the weak hands (potential sellers), just like short covering weakens a market.
-
The b and p profile is quiet easy to spot. I will try to find out what the Stealth Short-Covering means.Remember to put the b and p- profile in context. For stealth short-covering, think in terms of the market being down, then you get a little rally, then the market tries to take the market down again but doesn't take out the previous low, rallies again, tries to take it down and can't get much lower, etc. Smart money is probably getting long and the momentum traders are getting trapped. The momentum traders keep trying to take the market lower because that is what was recently working. Momentum traders will continue to do something that has been working until it stops working. Eventually, the traders that tried to keep taking the market down will get squeezed. That's the idea.
Is the cumulative delta another way to see these imbalances and in that case how does it show?
I don't use the Cumulative Delta much, but I believe that a high or low cumulative delta could indicate a strong (legitimate) up or downtrend and not nessarily indicate that a short squeeze or liquidation is coming. To determine whether the market is getting too short or too long, I look at the profile shape, direction, and volume. Keep in mind that just because you have an inventory imbalance doesn't mean it has to be corrected right away or even on that day. Part of it depends in which timeframe the imbalance occurs. Also, I believe that a cumulative delta, the way it is mostly used, probably only has short-term significance so it probably isn't very useful for monitoring longer-term conditions. I'm no expert so I could be wrong about this. Think about a b-shaped or P-shaped profile, especially the wide part, do you think that the cumulative delta would be high (or low depending on direction) in that case? Think about the cumulative delta when a market keeps testing a high/low and can't get through it. What would the cumulative delta look like in that case? Although, I didn't cover stealth short-covering or stealth liquidation, the cumulative delta would not ring a bell in that case either. So in short, I don't use the cumulative delta for monitoring for imbalances. I think you need more than that, but that's just based on my opinion and how I trade.


[MP] Trading with Market Profile
in Market Profile
Posted
Hi kuokam,
Sorry for the delayed response. I was in the process of putting together a post about high/low confidence and assessing which time frame is dominating the market, and the post was getting long and I was getting tired writing. So I thought it would be better, if we had a discussion. Do you want to join me in Skype some time so that we can discuss this? I will answer any questions you have about using Market Profile. Otherwise, you can take a look at this post I made a while back, but I could go into more detail in a live discussion.
http://www.traderslaboratory.com/forums/market-profile/6605-trading-market-profile-2.html#post73945
Feel free to PM me.