
Welcome to the new Traders Laboratory! Please bear with us as we finish the migration over the next few days. If you find any issues, want to leave feedback, get in touch with us, or offer suggestions please post to the Support forum here.


mohsinqureshii
-
Content Count
220 -
Joined
-
Last visited
Posts posted by mohsinqureshii
-
-
-
Try This ADAPTIVE CCI NinjaTrader indicator in your NT platform. This can also be known as ADAPTIVE COMMODITY CHANNEL INDEX indicator.
-
Keltner Channel
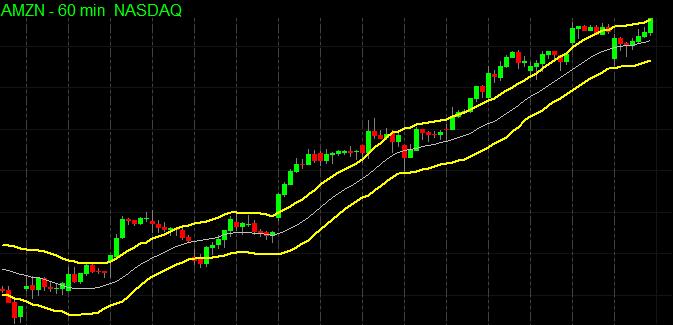
The Keltner Channel is based on a moving average line with upper and lower bands. The bands adapt according to the volatility of the asset (average true range). The Keltner Channel is used to signal price breakouts and price breakins, and to show trends.
Let’s see the indicator in action:
AMZN 60 Min Chart: TThe middle gray line is the moving average line, and the two yellow lines are the upper and lower bands. (You can set the colors and width according to your needs.)
The real magic of the indicator is the paint bar:
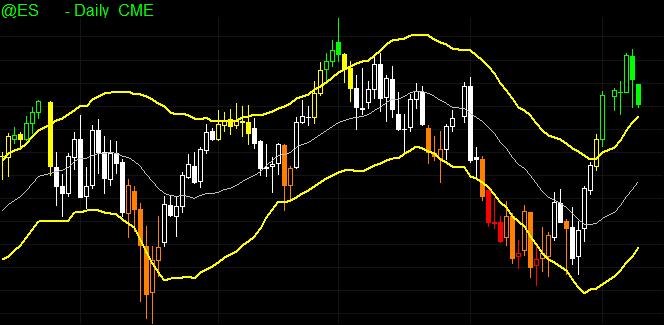
@@ES Futures Daily Chart: The bars are color coded according to their location.
Bars above the Upper Band: Green
Bars Above the Lower Band with highs above the upper band: Yellow
Bars between the Two Bands: White
Bars below the Upper Band with lows below the lower band: Orange
Bars Below the Lower Band: Red
With color-coded bars, you can take one glace at this indicator and receive all the information you need.
TradeStation: Download
MultiCharts – [ 64 bit - 8.0.5622 ] : Download
MultiCharts – [ 32 bit - 8.0.5620 ] : Download
MetaTrader 4: Download
NinjaTrader 7 and above: Download
-
Try This ATR RATIO NinjaTrader indicator in your NT platform. This can also be known as ATR RATIO indicator.
To Import The Indicators
1. Download an attached file to your desktop
2. From the Control Center window select the menu File > Utilities > Import NinjaScript
3. Select the downloaded file
-
Try This CALCULATE VALUE AREA NinjaTrader indicator in your NT platform. This can also be known as CALCULATE VALUE AREA indicator
How To Import The Indicators
1. Download an attached file to your desktop
2. From the Control Center window select the menu File > Utilities > Import NinjaScript
3. Select the downloaded file
-
The DIG Average True Range indicator is an improvement of the standard ATR – average true range indicator, which is a popular volatility indicator used by many traders.
The standard ATR is an amazing indicator, but it has one major inherited flaw.
When we use a volatility indicator such as the ATR, we want to know the real price action by how much the next bar goes up or down. However, when gaps have significant influence, as in the standard ATR, we no longer get what we want. After a large gap, the standard ATR indicator no longer reflects the real price action volatility.
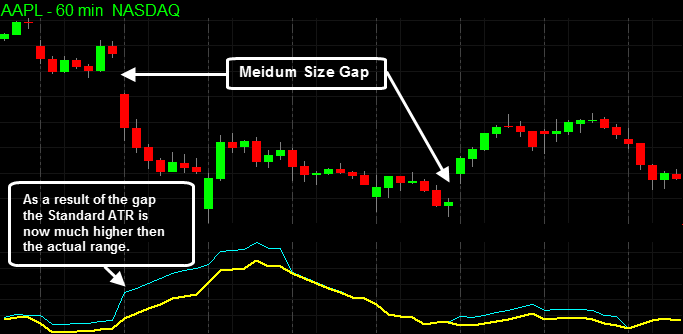
Take a look at the chart below, which compares the standard ATR indicator (light blue) with the DIG ATR indicator (yellow).
AAPL 60 Min Chart:
The chart compares our improved DIG ATR (yellow) with the standard ATR (light blue) indicator. Notice that even when a medium-sized gap occurs the standard ATR indicator jumps up and no longer reflects the actual price range, while the DIG ATR reacts to the gap in a much milder manner and continues to accurately reflect the price range. Also notice that when the market has no gaps the indicators are almost identical.
Most traders use the standard ATR to place StopLoss and TakeProfit orders. If you are one of these traders, you really need to try the DIG ATR indicator (which is free). The indicator will help you get more from your trades by providing you with more accurate data.
Key Features :
Adjustable length.
New extra feature – select the type of calculation [ full candle / only body ].
The indicator is also provided as a function.
TradeStation: Download
MultiCharts – [ 64 bit - 8.0.5622 ]: Download
MultiCharts – [ 32 bit - 8.0.5620 ]: Download
MetaTrader 4: Download
NinjaTrader 7 and above: Download
-
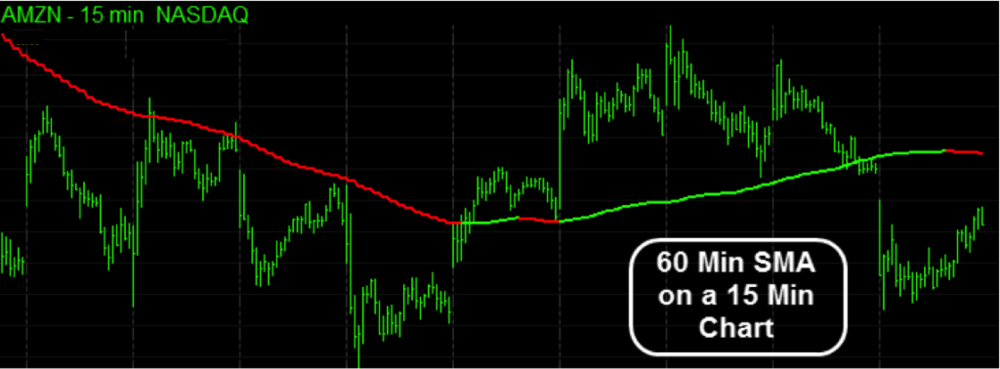
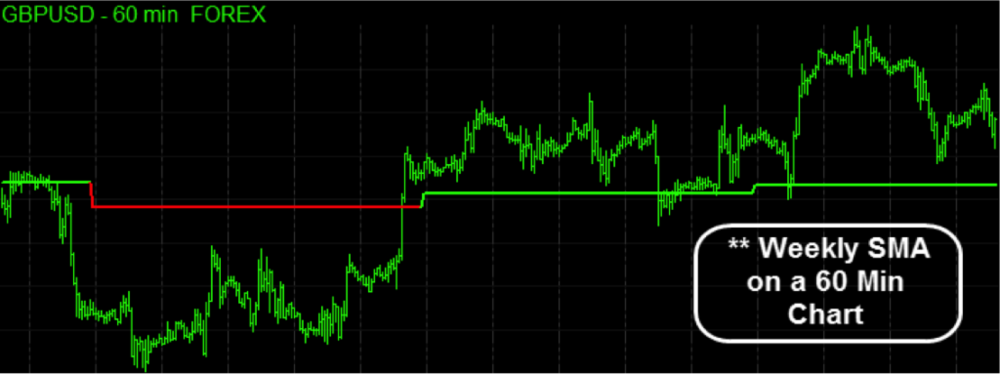
This unique indicator allows you to plot moving averages (simple, exponential, weighted) on any chart from any time frame. You can put a 60 Min SMA on a 5 Min chart or a Weekly WMA on a daily chart, and you can even take it to the extreme and place a 5000 tick SMA on a 15 Min chart. The possibilities are limitless.
Lets see it in action:
AMZN 15 Min Chart:
On the chart, you can see a 60 Min SMA when the symbol on the chart is only 15 Min.
GBPUSD Forex 15 Min Chart:
Here we have an example of a weekly SMA being plotted on a 60 Min chart. The possibilities are endless and we have given you full control to use it as you see fit.
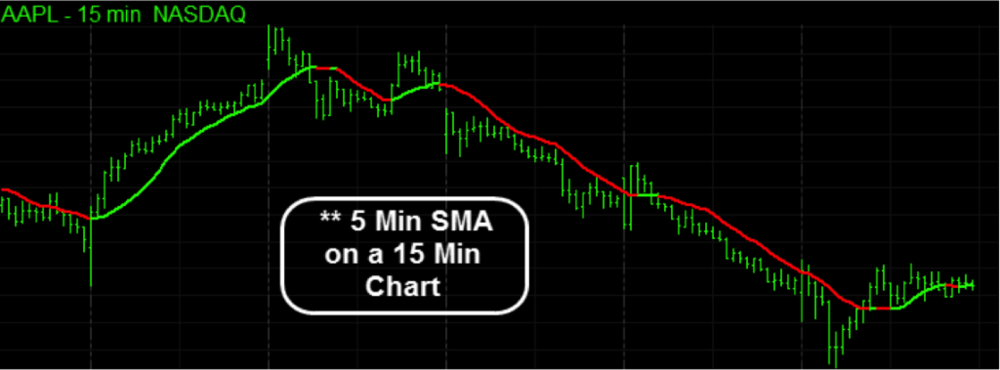
AAPL 15 Min Chart:
This employs a unique new approach; you can now place a 5 Min SMA on a 15 Min chart, providing you with a much tighter and more responsive MA
-
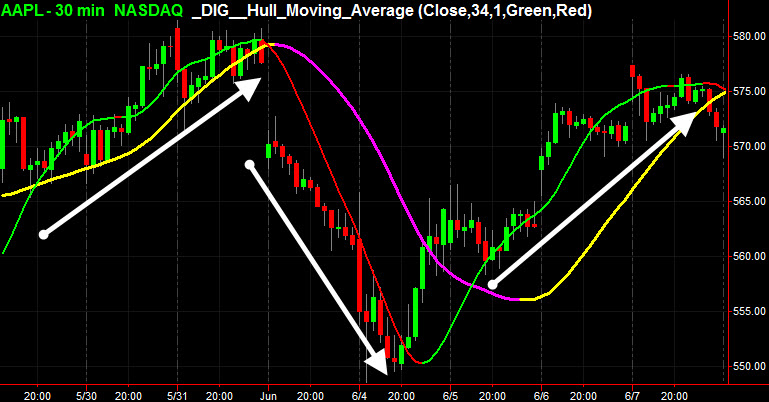
The DIG Hull Moving Average ― the HMA ― makes your moving average responsive to current prices while remaining smooth and not choppy. The beauty of the HMA is that it manages to eliminate lag almost completely while staying perfectly smooth.
This is what you are looking for in a moving average; it means that you can get your signals faster and make fewer mistakes.
How Does the HMA Compare to Other Moving Averages?
Let’s start by comparing the HMA to a simple moving average (SMA) of the same length. Just a quick reminder: The SMA calculation takes the past “n” closing prices and calculates their average; usually it is traded by taking a short and long SMA and when the two cross a signal occurs.
The SMA is associated with two problematic issues:
Longer length -> Lag becomes significantly bigger.
Sort length -> The MA becomes very choppy
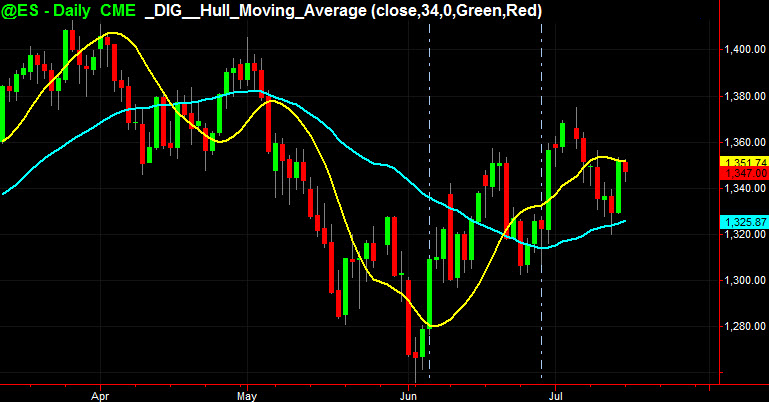
S&P500 Futures Daily Chart: On the chart you can see the standard SMA (length 34) in cyan/light blue, and our _DIG__Hull_Moving_Average (length 34) in yellow. The left side of the chart shows that while the SMA is still going up against the market the HMA is catching both pivots and switching direction while remaining smooth.
You can also see how big the delay/lag actually is by looking at the two vertical lines on the right; the SMA changes its direction about 15 bars later than our HMA – this means that you would have gotten into the trade earlier and enjoyed that nice bearish move.
Now let’s add the standard exponential moving average (EMA). The main idea behind the EMA is to provide more significance to the newer data there for eliminating lag; you will notice that the HMA is actually even better than the EMA as it will react faster but remain smooth.
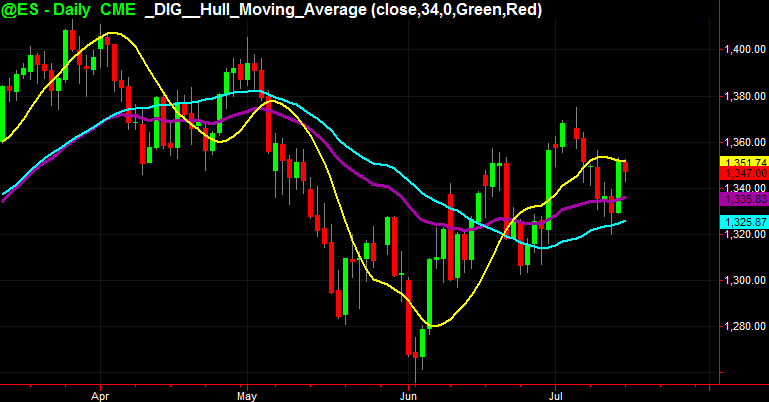
S&P500 Futures Daily Chart:
SMA (length 34) in cyan/light blue.
EMA (length 34) in purple.
_DIG__Hull_Moving_Average (length 34) in yellow.
You can see that the EMA is between the HMA and the SMA. It is more responsive than the SMA, but a mile behind the HMA. You can also see that the EMA line is not as smooth as the HMA line.
To sum up, the EMA is an improvement of the SMA, and our DIG Hull Moving Average takes this even further by providing a smoother and more precise moving average than you have ever seen before.
MA Trend Feature:
We have added another feature that makes this indicator even better. By using one simple switch, you can tell our DIG HMA indicator to color itself according to its direction.
Let’s see it in action:
AAPL 30 Min Chart: The DIG HMA is color coded according to its direction, making it much easier to get signals quickly. We have placed two DIG HMA indicators, one with the length of 34 and one with the length of 80; you can see three great cross signals.
Key Features:
Low lag -> Get in before other traders.
Supper smooth moving average -> Eliminate false entries.
New Feature – Color coded according to trend.
Easy to use and supports any chart and any time frame.
Download the free indicator:
TradeStation: Download
MultiCharts – [ 64 bit - 8.0.5622 ]: Download
MultiCharts – [ 32 bit - 8.0.5620 ]: Download
NinjaTrader 7 and above: Download
** For NinjaTrader users:
The RAR contains 3 files:
- ZIP file with the code of the indicator.
- Template (*.xml) that demonstrates the correct use of the indicator.
- PDF file that explains the different parameters of the indicator.
Please extract the RAR files to your desktop.
In order to import the ZIP file go to File -> Utilities-> Import NinjaScript.
In order to open the templates, save the *.xml files in your NinjaTrader folder -> Templates-> Charts.
Open a new chart, Right click on the chart -> Templates -> Load..
_DIG__Hull_Moving_Average_[Ninja].rar
DIG-Hull-Moving-Average-MultiCharts-8.0.5620-32-bit.zip
-
-
Trend Pattern Prediction System
If a discretionary trader expects the market to rise tomorrow, he would probably look for opportunities to be a buyer. Similarly, if he expects the market to drop, he'll probably try to short the market. Oddly enough, trading systems rarely work this way. Generally speaking, trading system don't try to predict the market. They merely try to follow it. In fact, it's usually considered counter-productive to have an expectation for market direction when trading a system. Whether your personal prediction is for an up trend or a down trend, you're usually well-advised to follow your system, regardless of whether it goes long or short.
This doesn't mean there's no role for market prediction in the world of trading systems. A common technique is to predict the price change N days forward. If the prediction is for the market to be higher in N days, you would buy today and sell in N days. Likewise, if the prediction calls for the market to be lower in N days, you would sell short and cover in N days. If the prediction indicates the market will not change enough to exceed transaction costs, you would stay out of the market. The prediction itself can be achieved via any one of a number of methods, one of which I'll develop below.
While this approach may be profitable, it tends to emphasize the prediction part of the strategy over trading system logic. Most profitable trading systems probably succeed in large part because of the way they combine entry and exit rules to best capture profits while minimizing losses, following the classic dictum "let your profits run, cut your losses short". Moreover, certain entry rules tend to favor specific market conditions, where particular exit rules tend to work best. Simply buying today and selling N days from now because the prediction calls for a higher market in N days neglects to take into account the basic tenets of trading system design.
An alternative approach, which I'll develop here, is to predict a specific tradable pattern and, when found, apply a set of trading rules specifically tailored to that pattern. In this way, the prediction logic is combined with trading system logic, giving us the best of both. I'll illustrate the approach using a trend pattern, but other patterns, such as reversal patterns, could be used as well.
-
-
-
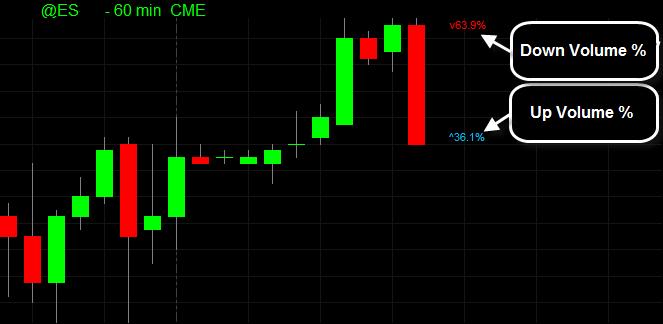
DIG % Bar Bias Indicator
Volume places a major role in our trading decisions. The %BarBias indicator gives you inside in to the power struggle going on inside of the bar. By providing you with on chart representation of the ratio between buying and selling volumes. No sub graphs needed simply add it to the chart and get that crucial bit of information exactly where you need it.
Lets see the indicator in action:
@ES Futuers 60 Min Chart : Notice how the Down Volume is represented by the red text on the top of the bar (63.%), and the blue text on the low of the bar represents the Up Volume. Together the sum will always be 100%
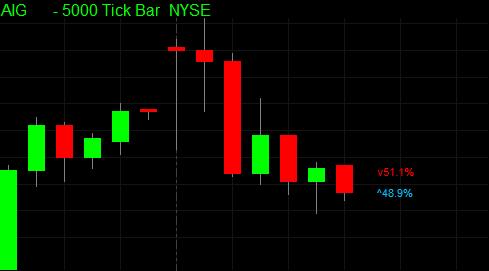
AIG 5000 Tick Chart : Here you can clearly see that power of the indicator, it not only works great on Minute charts but also on tick and volume charts. Giving you the extra boost you need.
DIG % Bar Bias for MultiCharts 7.4 (Build 4953): Download
DIG % Bar Bias for MultiCharts 8.0.5203 – Beta 2 – 64 bit: Download
DIG % Bar Bias for MultiCharts 8.0.5375 – Beta 3 – 64 bit: Download
DIG_BarBias_MultiCharts_8.0.5375_Beta_3_64_bit.rar
-
What is the DIG % Bar Bias Indicator?
Volume places a major role in our trading decisions. The %BarBias indicator gives you inside in to the power struggle going on inside of the bar. By providing you with on chart representation of the ratio between buying and selling volumes. No sub graphs needed simply add it to the chart and get that crucial bit of information exactly where you need it.
Lets see the indicator in action:
@ES Futuers 60 Min Chart : Notice how the Down Volume is represented by the red text on the top of the bar (63.%), and the blue text on the low of the bar represents the Up Volume. Together the sum will always be 100%
AIG 5000 Tick Chart : Here you can clearly see that power of the indicator, it not only works great on Minute charts but also on tick and volume charts. Giving you the extra boost you need.
Key Features:
Easy To use.
Control Text color
Works Great with Tick, Volume and Minute bars
NO SUB GRAPHS NEEDED
-
-
Description
Wilder’s Volatility System, developed by and named after Welles Wilder, is a volatility index made up of the ongoing calculated average, the True Range. The consideration of the True Range means that days with a low trading range (little difference between daily high and low), but still showing a clear price difference to the previous day.
Install Instructions:
1. Download the attached file to your desktop
2. From the Control Center window select the menu File > Utilities > Import NinjaScript
3. Select the downloaded file
-
Description
The 350 Swing indicator was published in the February 2010
Install Instructions
1. Download the attached file to your desktop
2. From the Control Center window select the menu File > Utilities > Import NinjaScript
3. Select the downloaded file
-
While trading its always many different sentiments either you are loosing or making money.Talking about loosing trades I start smoking a lot as when I don't know why traders smoke a lot while loosing money - I think its just because they want to keep them self out of tension and I do the same but I don't have any answer for that - I have seen many people shouting at their colleagues , even children while they are loosing money but I have a way to keep myself relaxed and that's my cigarette pack.
While making money its totally opposite shouting and hugging the friends and colleagues while making a good money - and some times they are out of control and unintentional while sitting in a meeting and watching the profitable trades and laughing even the boss is in a very bad mood and scolding for some mistake.
I am a trader and these things are part of my life.
-
I wonder how can you make in a single trade. I am not a big trader and don't trade with millions of dollars still I was able to make a a good amount in a single trade.
It was 2 years back and I cannot forget that morning when I traded hangseng index and I got a profit of 4800 $ ( 480 pips )in a single trade and it was just in couple of minutes after HSI Index got opened.It was no doubt a big risk and it can be on either way but I won that trade.
-
What are your feelings about volatility? Does it scare you? Does it make your eyes light up when you see it? Discuss here.
My views about Market's volatility are that I enjoy trading in volatile markets - I love it when markets are coming up and down frequently - I enjoyed trading them when I make a good amount of money or loose them - However it make me more aggressive while trading and I can trade a lot of positions with small profits and small losses. In my opinion its dangerous as well but have to take risks as I believe without risk there is no success.
What's your success story concerning Volatility?
-
where are you based, what futures do you wish to trade, what is your time zone.....etc?I use Interactive brokers - however i used to also have an account with MFGlobal, so my recommendation clearly means s..t

(plus are you sure you mean low leverage at 1:100?)
Yes I am sure because I have never traded futures and got information from some brokers that there is some maintainable charges on holding positions overnight and I just wanted to avoid that. 1:100 would be fine for me with good raw spreads and low commissions.
I am based in Pakistan and Interactive Brokers normally don't open accounts from Pakistan so any other recommendation.
-
Your trading systems tell you about what to trade and when to trade...but how do you set the size of your trades?For example, I do not open more than 4 positions. I do not risk more than 0.5%/position.
0.5% in a single trade or all 4 positions ? and 0.5% of the total account size ?
By the way how much do you expect while risking 0.5% ?
-
Well said
I don;t know what happened to Silver these days its on a same channel and just like a turtle - but there is always a silence before wind comes so same is happening with it.
And at last SILVER Made my Day on 20th
After one month of silence it broked and I enjoyed this week trading silver. Some times I really hate it - but now I AM LOVING IT -
Nice article but.
the people you mentioned as GREAT TRADERS have more frustration when they are loosing and they don't know when they will be exiting from the trades.
while the people you mentioned as GOOD TRADERS have less frustration when they are loosing because they knew when they will exit and how much they afford to loose as they have placed the stop losses.
In my view GOOD Traders are LOT better then the great one's ( The GAMBLERS )


BAR NUMBERS NinjaTrader
in Trading Indicators
Posted
Try This BAR NUMBERS NinjaTrader indicator in your NT platform. This can also be known as BAR NUMBERS indicator.
To Import The Indicators
1. Download the file.
2. From the Control Center window select the menu File > Utilities > Import NinjaScript
3. Select the downloaded file
BarNumbers.zip