
Welcome to the new Traders Laboratory! Please bear with us as we finish the migration over the next few days. If you find any issues, want to leave feedback, get in touch with us, or offer suggestions please post to the Support forum here.


pipsaholic
-
Content Count
67 -
Joined
-
Last visited
Posts posted by pipsaholic
-
-
Is there an indicator that can change all 20-30 pairs to 1 timeframe with 1 click rather than going into 20-30 of them and setting each one up?
-
Looking for a indicator similar to a pivot point but rather than calculate from previous days high low open/close/3 it calculates it back 10 or 20 candles back and it changes every x amount of candles you choose, anything like this exist?
-
Its to get the average range based candle range and the impulsive candle ranges seperately rather than calculating them together.
-
Do any brokers do pound against the argentine peso?
-
Anyone trade options are the premiums the same as spreads on fx spot market or more expensive? None of the website mention what the premiums are or event examples??
-
Hi,
I'm looking for an mt4 indicator that deletes candles according to their size for example 1 candle is 10 pip required, while candles below 1 pip are removed from the chart for analysis and backtestings purposes.
Thanks. -
Anyone got historical stats on chart patterns on different pairs?
I read the head and shoulders pattern is the most common in all markets over others never seen stats on it however. -
Always read that Astro trading is for longer term trading, but recent advances in software that can tell us to the second and minute when planetary movements/ingresses/regressions are happening can this be used to scalp the market?
-
OK looking for a list of different types of charts some brokers offer.
Candlesticks, Line, Bar, Renko, Range, Tick, Mountain, Point & Figure, Dots, Invisable (I joke you not), Order flow/Price ladder charts,
Any others that help you trade? -
Hi,
Does anyone use or any broker have charts quicker than 1 tick charts? Milisecond or Nanosecond charts?
Thanks. -
Looking for a horizontal line indicator for mt4 that draws lines of the last 10/20 candles and adjusts as price moves it has to be customizable not set.
Makes life easier rather than using your crosshair tool or drawing lines every 10-20 candles.Find your Favourite Pattern -
Looking for an indicator or script that can close out partial positions and also has the option to close the full position and customize size all from the trading panel without popping up another window entering values as normal takes too long. Its all about speed when scalping and seconds costs money.
-
How often do you get big winners not had one in months? 1 in 20 or 40?
-
Anyone who has a solid trading strategy found by increasing trading frequency helps or hinders there progression?
Willing to take more hits to get to the final goal as the numbers i believe work out in the end rather than setting an x trades per day limit.
Yes like the majority state trade less and less and more less and get nowhere. -
Moving Averages work all the time anyone who says they dont they dont know what a chart is or what one looks like.
Backtest it last few months and you will see its best to trade after a multiple cross when there is angle and seperation and price always bursts in that direction.
the 20, 50 and 200 MA are used by most traders.
-
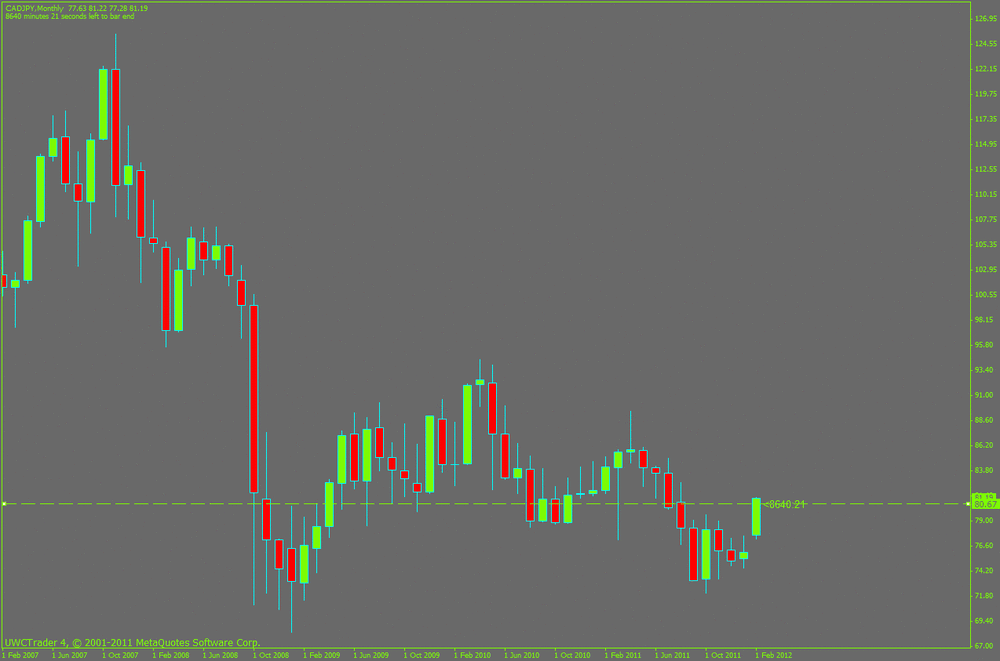
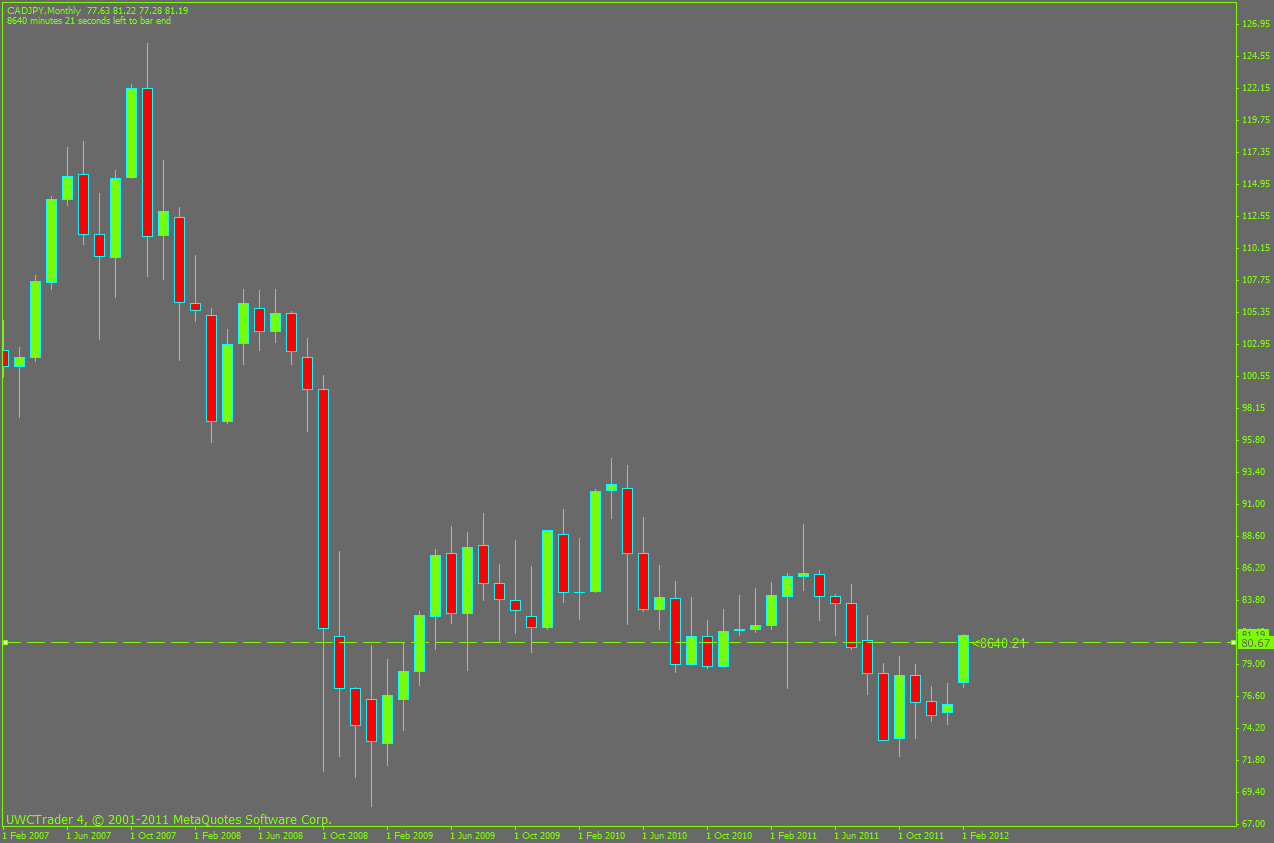
Hi,
When these types of bars come up on any timeframe are they stronger the more previous support or resistance points they break?
E.G
This CAD/JPY on the monthly has broken 6 previous months high lows likely to close end of month at this level does this make this bull very strong as its 6 months its broken resistance?
Also, it has a GAP underneath it does that act as extra support/supply? Is price action likley to revist the gap?
Thanks.
-
Hi,
Is it possible to know divergance through pure price action without using any indicators?
Thanks.
-
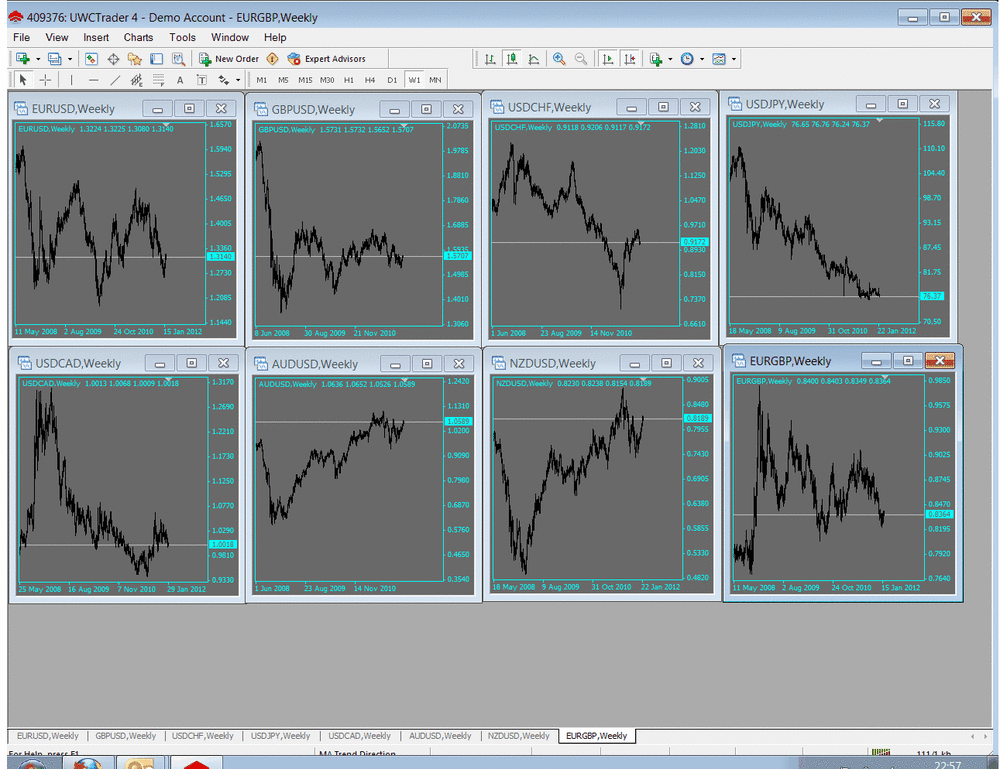
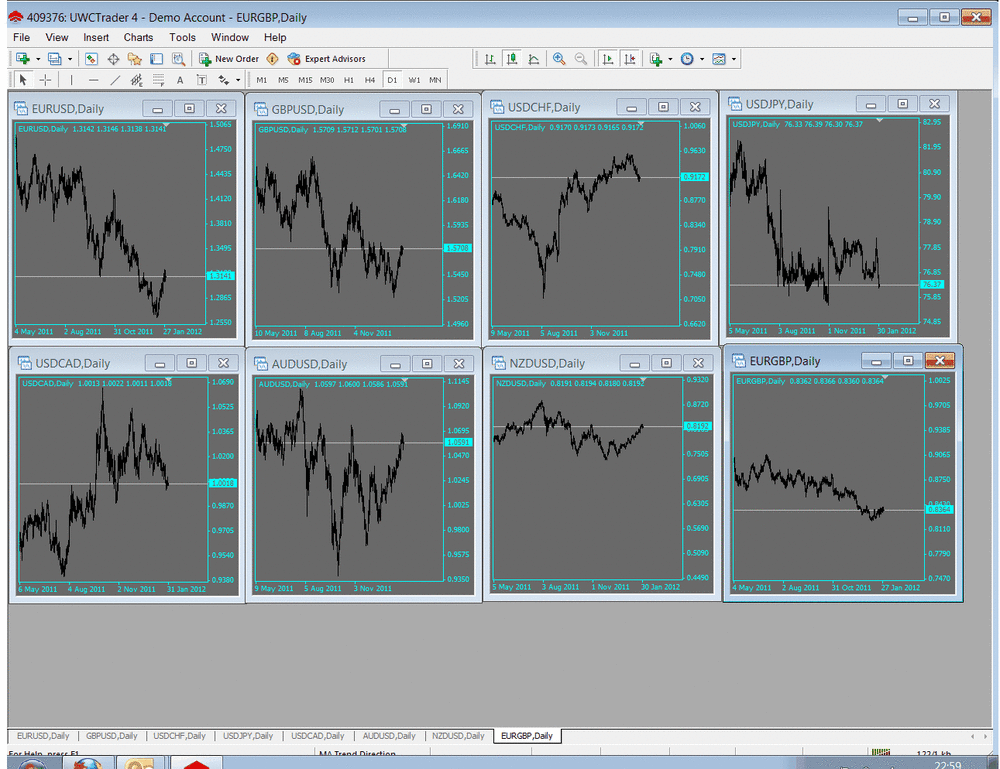
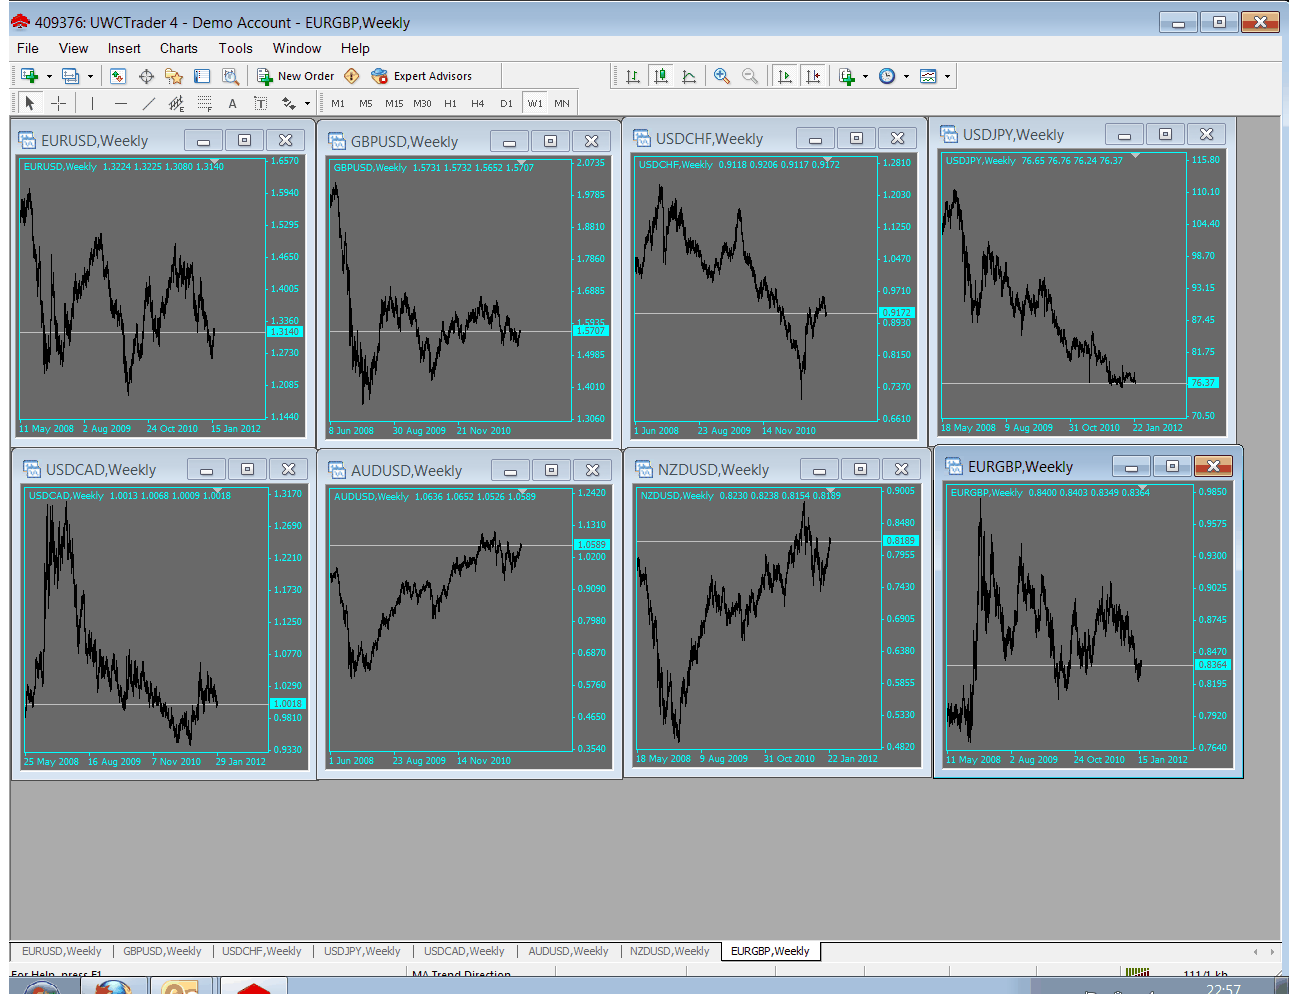
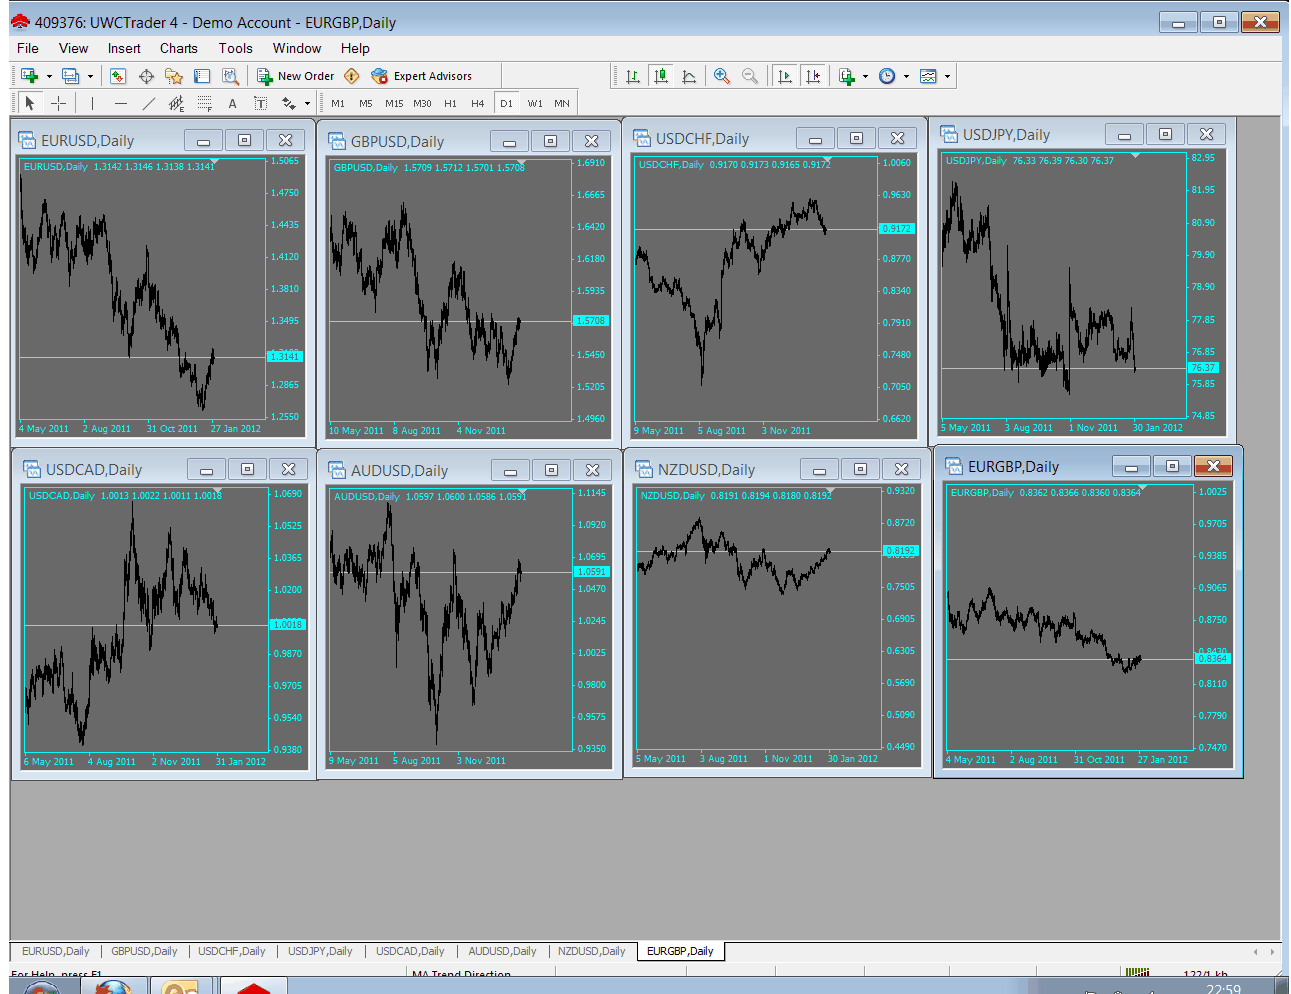
you have a few weeks of data.Take the MAs off, or whatever they are, change the timeframe to weekly, and post the same charts with a min of 150 data points, showing only the weekly bars. Then do the same with daily and show about a year of daily data of whatever fits on your chart so that they days are still distinguishable. If it is not clear at that point, then post the charts and I will help you.
Okay I have attached can you tell the strength of the trend without MA's?
-
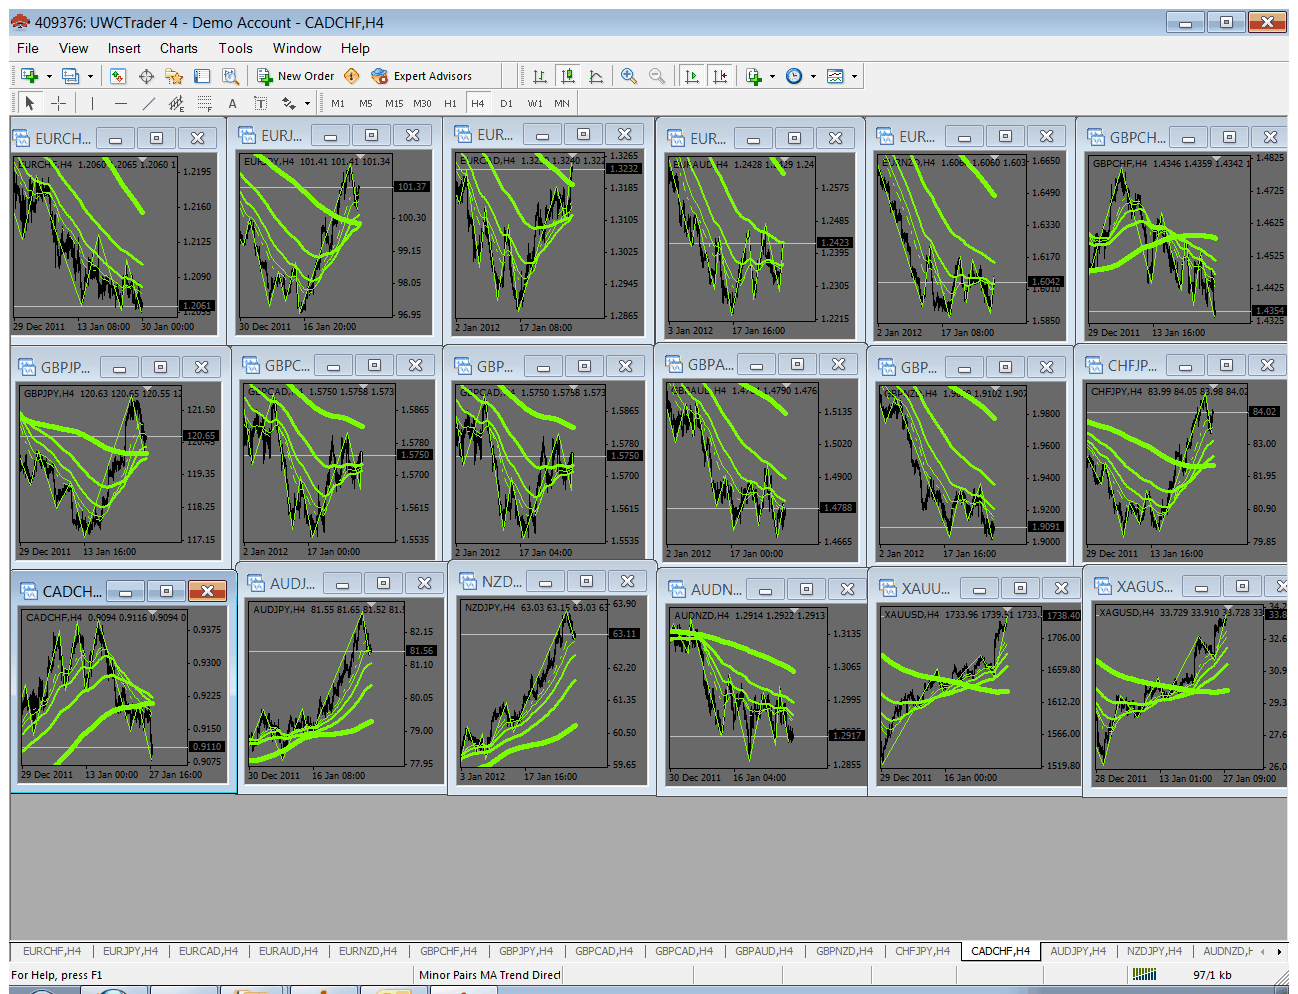
Hi,
Just looking for some input from the pros about these pairs which have MA's added to them, which they would feel would be the strongest going up/down? Is the steeper the MA's the healthier and stronger the trend going up n doon?
Thanks.
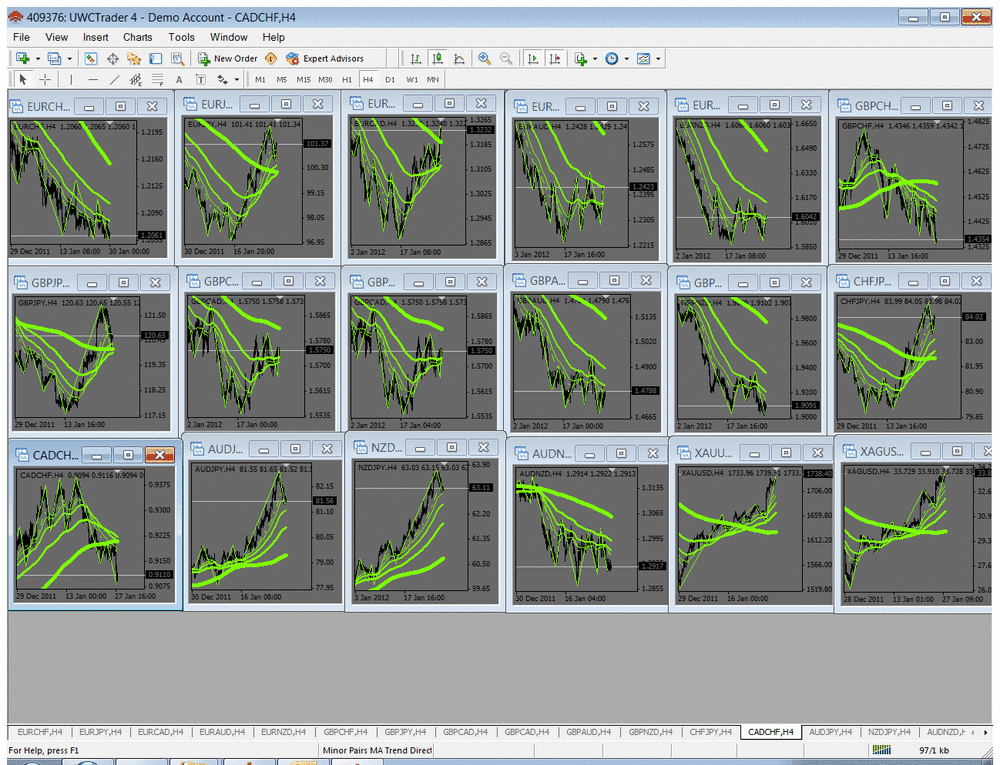
-
Great stuff do the commericals matter at all?
-
So, that would be 59.2% change in trend?
-
Does the blue or red line have any significance? or just ignore it? do you look at both fx futures and euro/dollar pair on this site or just 1??
Also, i got this info but it baffels me:-
3-MONTH EURODOLLARS - CHICAGO MERCANTILE EXCHANGE Code-132741FUTURES ONLY POSITIONS AS OF 01/10/12 |
--------------------------------------------------------------| NONREPORTABLE
NON-COMMERCIAL | COMMERCIAL | TOTAL | POSITIONS
--------------------------|-----------------|-----------------|-----------------
LONG | SHORT |SPREADS | LONG | SHORT | LONG | SHORT | LONG | SHORT
--------------------------------------------------------------------------------
(CONTRACTS OF $1,000,000) OPEN INTEREST: 7,662,714
COMMITMENTS
362,301 806,161 1528252 4964207 4374131 6854760 6708544 807,954 954,170
CHANGES FROM 01/03/12 (CHANGE IN OPEN INTEREST: 72,740)
96,173 -29,358 47,640 -170,280 66,069 -26,467 84,351 99,207 -11,611
PERCENT OF OPEN INTEREST FOR EACH CATEGORY OF TRADERS
4.7 10.5 19.9 64.8 57.1 89.5 87.5 10.5 12.5
NUMBER OF TRADERS IN EACH CATEGORY (TOTAL TRADERS: 235)
38 54 75 125 124 208 214
EURO FX - CHICAGO MERCANTILE EXCHANGE Code-099741
FUTURES ONLY POSITIONS AS OF 01/10/12 |
--------------------------------------------------------------| NONREPORTABLE
NON-COMMERCIAL | COMMERCIAL | TOTAL | POSITIONS
--------------------------|-----------------|-----------------|-----------------
LONG | SHORT |SPREADS | LONG | SHORT | LONG | SHORT | LONG | SHORT
--------------------------------------------------------------------------------
(CONTRACTS OF EUR 125,000) OPEN INTEREST: 294,263
COMMITMENTS
29,770 184,965 1,131 231,765 50,103 262,666 236,199 31,597 58,064
CHANGES FROM 01/03/12 (CHANGE IN OPEN INTEREST: 11,473)
-10,671 5,615 199 18,780 3,187 8,308 9,001 3,165 2,472
PERCENT OF OPEN INTEREST FOR EACH CATEGORY OF TRADERS
10.1 62.9 0.4 78.8 17.0 89.3 80.3 10.7 19.7
NUMBER OF TRADERS IN EACH CATEGORY (TOTAL TRADERS: 183)
28 82 14 48 45 88 129
-
I check the overall trend (ichimoku clouds), which way the speculators are betting (CoT report), trendlines, support/resistance lines, candlestick formationsCool, do you find the COT report useful do you use an indicator I am learning how to read it do you require to calculate it manually I found this website am I right and saying I look for the green line to go with the large non commercial speculators rather than hedgers or small specs?
Do you select the currency pair as it states or are we looking at euro future? As fx doesnt have a central exchange?
-
I see a cross over on the 1 min chart on EUR/USD at 10.47am MA it worked, but still stick to market structure along with MA system.
The Real Forex Trader Series 2
in Forex
Posted
Anyone tried it?