
Welcome to the new Traders Laboratory! Please bear with us as we finish the migration over the next few days. If you find any issues, want to leave feedback, get in touch with us, or offer suggestions please post to the Support forum here.


livernik
-
Content Count
31 -
Joined
-
Last visited
Posts posted by livernik
-
-
What you are looking for there seems to be an irregular flat for the bigger correction, but .......as there is always a but......what comes next is nothing close to Elliott or something else.....any explanations?
thanks
TW
Prices in stock exchanges ( usa , german etc. ) may go more easily higher as no obvious resistance exists while a top may appear sooner or later .
Only projected resistances exist.
May be the simpler of them is the one described in terms of equality. I have chosen equality as I ’’ forced ‘’ myself to analyse in a simple way comparing the current wave with each of the 3 significant moves in the past attempting to the '''sooner ''
The assumption is that the current wave may either end or at least find resistance at the measured prices.
-
The following maybe of some help .
Looking for possible TOPS in SPX 500
The height of the 3 rectangles named a b c , ( left side ) end all to the 1538.5 obvious maximum.
The beginning is chosen as drawn from significant points.
We compared the current bullish wave that started from point 3 gray circle. ( the same rectangles on the right side )
We have chosen a fibo expansion ‘’1’’ ‘’ 2 ‘’ ‘’ 3 ‘’.
Conclusions as far
Current price 27 dec , being 1840
overpassed 1715 -gray rectangle
Still below 1977 and 2085
The fibo expansion ‘’1’’ ‘’ 2 ‘’ ‘’ 3 ‘’ projects 2085 that almost coincides with blue rectangle ( the highest of 3 )
This makes this point of great interest.
Prices at 1715 1840 1977 2085 are of great importance .

-
This ''strategy'' , you mean some sort of ''feeling'' that comes out of experience after the careful obsevation and abandon indicators in general even the concepts of res and supp ?If you watch the Price very carefully and monitor the ask-bid volume you will come to understand The Quants perspective.
From this knowledge you can devise a strategy to put you into the market and then pull you out again.
IMO this is time better spent than following TA history.
-
I have the info I need for higher time frames observing the SIGNALS OF CERTAIN INDICATORS in higher time frames ,in Tradestation FXCM , using the indicators with the following name
( name of indicator ) Heat_map.
Example: You look at 60 minchart and want to know the signals of the indicator ‘’supertrend’’in charts 2H, 4H, 8H, D
Find in tradestation : SUPERTREND_HEAT_MAP NEW2 , Check the existing base for a''heatmap '' indicator for other instruments.
Was this what you asked?
-
Maybe dangerous is not the word .
For me it was difficult to apply an approach that needs to be very quick and alert.
-
In general, scalping is dangerous.
-
I voted ,No .
U.S are very flexible and quick in taking the appropriate measures ,especially as compared to E.U .
-
Great post , morpheus, congratulations.!!!
-
-
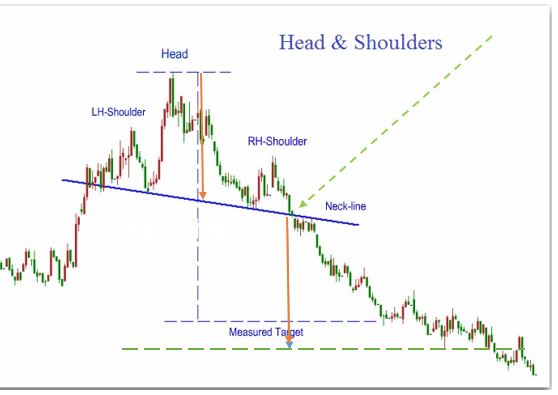
Richard , Hi,
About the calculation of the measured target
As far as I know the measured target should be calculated by taking the right red arrow - equal to the red arrow from the head and put it on the breakpoint of the neckline -as green arrow indicates. The final target is the green horizontal dotted line. This is the case as neckline is not horizontal in this example.
-
Very useful article. Could you pls give us some more examples and tips?
-
''' For example, when multiple left and/or right shoulders appear, the structure would be classified as a Complex Head and Shoulders pattern.'''
We could classify '' Complex Head and Shoulders pattern''as the general case ,
1. In case a pattern has no shoulders ( both left and right) but only head , , it remains the ''cup'' pattern
2. In case a pattern has no left shoulders but only head and right shoulder it remains the pattern ''cup with handle''
1 and 2 may be considered as subcases of the general case.
-
In case again of FTSE _ASE 20 GREECE WEEKLY 11 10 2013
The first neckline , light blue colour,has a clear S-H-S formation but fails to break upwards and give the neasured move because of a resistance .The resistance'' worked ''.
Now one may consider a new ''candidate '' neckline, pink colour with the right shoulder ''under possible construction''.

-
I expect Harvey 1 to continue explaining chaos theory as I never had the chance to go through it in depth.
Maybe zdo is right or not , I would like to know more about his view.
-
Tr. W : I agree it is a bit ‘’fishy’’ ‘’by the book’’, thanks for pointing this.
If you read my first post I wrote that a neckline can be seen as a support line . This gives support or is broken, retested etc.
I named it as ‘’neckline’’ as the formation above it reminds of H&S formation .
-
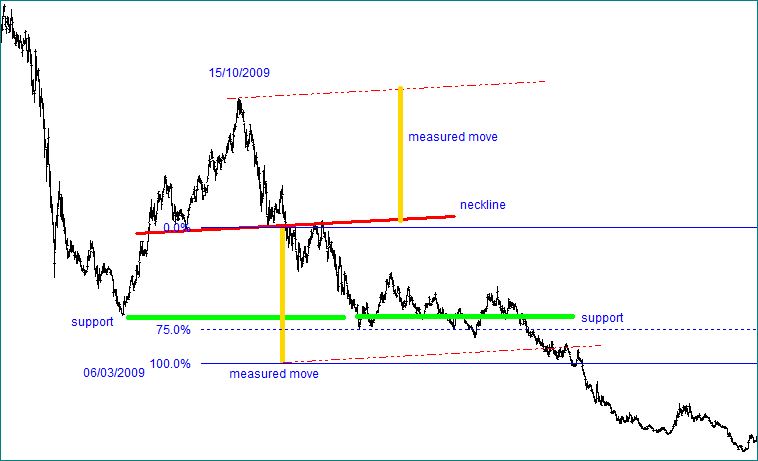
the chart from Greek Index Ftse ase 20 , ( now ftse 25 ) period 2009
Support works well before the measured move.
The suggested 70..75 % by trading wizard IS A COMPLETE SUCCESS!!!
-
In case of H&S patterns I could say
1. The neckline is a simple resistance line , the visibility of the shoulders and head as described by trading wizard …helps …is a kind of alarm that this resistance line may be it would be broken.
2. The measured move is o.k as described by trading wizard BUT ONE SHOULD TAKE INTO CONSIDERATION the next resistance above the neck line , traders forget this.!!
In case of inversed H&S patterns the neck line is a support line and …so on
-
I have the feeling that DAVT is going to give more info about his method.It is about time to do so, as now after so many posts we will pay more attention to his methodology.
-
I tried page 2 and an error appears.Where can I find the indicator ? Thankyou.
-
Hi J Turner ,
About optiontimer method
I will try to help a little ,( AS I COPIED THE BASICS FROM PREVIOUS POSTS)
stoch rsi in metastock language is ( copy paste from previous posts and worked for me ):
bars:= Input("Periods",2,255,7);
Rs:= RSI(C,bars);
StochRsi:= (Rs-LLV(Rs,bars))/(HHV(Rs,bars)-LLV(Rs,bars)+.000001)*100;
StochRsi
If you cant do it with stoch rsi , you may use
momentum 8 , or stoch 7 or something similar
You also need
EMA 21
EMA 65
I SUPPOSE YOY MAY PLAY WITH PARAMETERS AROUND 21 +- AND 65 +-
Try to keep ratio 21 to 65 around 1 to 3
so you have as time parameters:
7 ..stoch
21..ema
65 ..ema
The best is to go through all the posts , in brief here is some copy paste"( from previous posts )
......
When the 21 EMA is above the 65 EMA, we do not want to be short, and we may be looking for a long entry signal. Only oversold readings( bottom prices ) of the stochRSI are relevant, and they are relevant if and only if price has retraced back to a level between the EMA's or even slightly below. A long entry is signaled when stochRSI has turned up on a closing basis, and entry is made the next day if price makes a higher high than the prior day.
When the 21 EMA is below the 65 EMA, we do not want to be long, and we may be looking for a short entry. Only overbought readings ( at the tops ) of the stochRSI are relevant, and they are relevant if and only if price has retraced back to a level between the EMA's or even slightly above. A short entry is signaled when stochRSI has turned down on a closing basis, and entry is made the next day if price makes a lower low than the prior day. .....
In previous posts you will find charts and many interesting instructions.
-

Daily euro usd
Is the green rectangle the exact entry as οτ method??
-
Germany is trying to impose to other EU countries it's own imperium. Sooner or later , people in the rest EU countries will resist on that . In this case it will be Germany that will go out of EU. Euro (and other currencies that the rest nations will bring back ) will go down, dollar will go up. This will give room to US to print money again to face it's own problems.The Deutsce Mark at the beginning, at least, it will go up and thus German products will become expensive.Germany will lose a big portion of the markets of ex EU markets.
-
Can anyone refer me to any reference work on risk and time in the market.Thanks.
I don't know any reference work about, but if there is any , many "...it depends on ..." should be included.
In previous posts ,replies were based in personal experience.
I believe in cash, taking quick profits and cash again.
-
Very good article. May be I feel what it means by self soothing, I expect anyway more details about , as this point is critical. Successfull traders had this as a "gift"or have trained themselves to arrive to this point ?

Dow Jones = 100,000 Target
in Market News & Analysis
Posted
''Sooner or later '' has the meaning and reminds that from a zero basis concept anything may happen. It is placed in an introductory phrase and does not need to be ''a relative term in trading ''