
Welcome to the new Traders Laboratory! Please bear with us as we finish the migration over the next few days. If you find any issues, want to leave feedback, get in touch with us, or offer suggestions please post to the Support forum here.

emac
-
Content Count
56 -
Joined
-
Last visited
Posts posted by emac
-
-
Is this always the case?TIA
From what I understand now, an FTT is a failure to traverse to the LTL and it must happen on a dominant move. So conversely, if it hit the LTL, then it can't be an FTT.
A VE can be different in that what appears to end might already have a lower fractal m1 m2 move for the ftt to occur within the 5 min bar (credit to EZ).
According to Jack, an FTT must occur on a dominant traverse. I would understand that to be when looking for an FTT on the tape fractal, I would need to see a dominant bar in this case. I can't say if that is always the case but right now, this is what I look for prior to any FTT.
emac
-
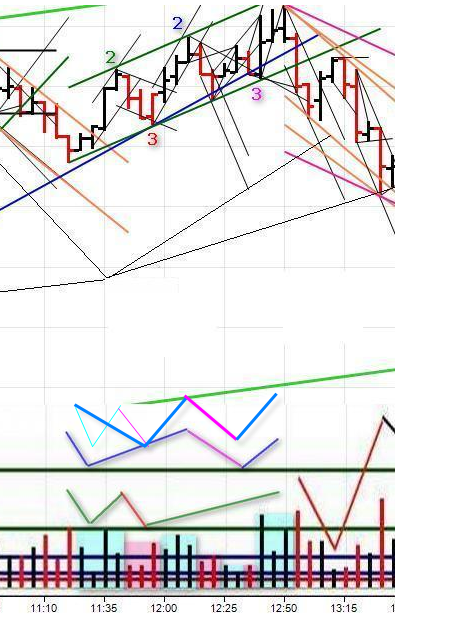
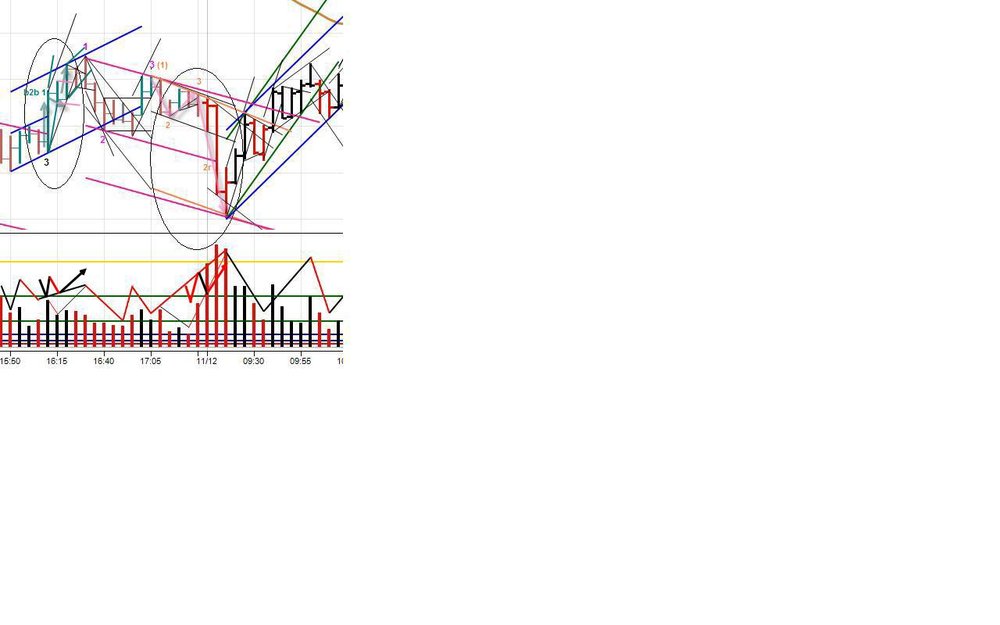
(using Gucci's DAX H11 chart) Which set of annotations makes more sense?a) green, red
b) blue, purple
I would have drawn the gaussians slightly different. B2B would end at bar 12:10 with nested fractal completing a faster fractal b2b2r2b. Since LTL was reached, no FTT yet so wmcn is new point 3. I would have looked at it according to Corey's standpoint that in real time, I wouldn't know before 12:10 would there be a new point 3 until LTL is reached at end of the 12:10 bar.
If I am wrong in not knowing there would be a new point 3 prior to end of the said bar, that would mean I miss another fundamental step in my observations.
Another challenge would be to anticipate there is yet another faster fractal to complete first for the 2R non-dom retrace (to get to pink pt 3) before heading to FTT. During live session, might not be easy to see and hold through the 12:25-12:30 decreasing black bars if one is not clear in the head of the sequence of events. During 12:35 red intrabar , prv might be showing high increasing red vol indicating that potential BO of RTL in real time. I guess if one is to say that there would be not be an RTL BO since no FTT can occur without a dominant black move first which didn't occur yet at that time and not until bar 12:40 increase black dominant bar and then FTT at 12:45.
emac
-
Anyway... one should have known this will be so before this bar....
How????????....................Suspense..................

Look at the bar labeled ftt. Do you really see black dominant volume there? NO!!!!!! What does that mean???? The market didn't complete its sequences. What is the logical consequence???????
HTH.
Hi gucci,
If this is referring to bar 70, then I do see a black dominant bar on the volume in ftt occured. Now there was no VE either on that traverse up to indicate a new point 3. Comparing bar 70 and bar 75, I see both showed dominant volume bar. Perhaps my definition or understanding of how a dominant bar should look like (increasing black in the dominant direction of the current sentiment which was black), then I fail to see why bar 70 does not have a dominant volume bar. Can you further point me to where I fail to see the difference ?
TQ.
-
Volume leads Price. Always. And without exception.Much debate has ensued over the years with respect to whether or not Volume represents helpful and / or useful information with respect to understanding Price change....
Rather than create yet another environment for posting opinions or sowing the seeds for epic battles over dogmatic philosophies, my goal here is to provide a framework, for anyone with an interest, to learn how to learn to ‘see’ the Price / Volume Relationship at work as shown through the fractal nature of all markets. In other words, this thread isn’t about me teaching people to trade, ‘calling’ trades or seeking converts to a new religious cult. This thread is about the individual trader developing the skills needed, and the knowledge required, to learn to trade based on what the market says, instead of what the trader believes (or I post). ....
To reiterate, this thread will not teach you to trade. If you are looking for a canned set of rules for entry and exit, look elsewhere. However, this thread will teach you to learn how to teach yourself to trade using the only tools you’ll ever need – a chart and your own brain.
- Spydertrader
Vienna,
I can understand and appreciate the frustrations of a student or someone new trying to learn especially through forum threads. I know how you felt and feel the same many times before. I believe there have been others as well. If I am not wrong, one example, I quote is Gucci who apparently had "get it" after going through the same, maybe longer. Believe me I had the same issues in studying the JH method.
But what I found was that those who offer to help are sincere and trying their best. I found that the process was done in a way for us to discover the way to read the markets, rather than to point and show us that is so, as many would have love it to, as would me LOL.
But the market does not appear as simple as 4 vol moves and 3 price moves to us newbies, or at least to those untrained to see it so. Hence, I think IMHO, we need to go through the drills and screen time to be able to correctly annotate it and see the market in its fractals. It might not be a short journey and its also has been many months for me.
I appreciate those who took their time to post the questions like yourself and many others some of whom are no longer active, because it is through these questions, that we the more quieter or busier ones can learn; when we have the time to. Many times when I do not understand something, I would move on till later someone else posted a more correct question and the answer comes along as sometimes, I would find myself in a situation of not knowing how to ask
. I can imagine what went through those who untiredly continued to answer questions upon questions (and mostly the same ones!) over the months if not years (cnms2, gucci, corey, tikitrader, spyder, etc, etc). I can see they too had to continue to post charts and edit charts posted in order to help in the best way they can.I hope you do not take offense of my comments. I can see you are also sincere in learning. I am still very much in the process of learning too but if you like to perhaps share thoughts and to help each other along, you are welcome to PM me.
Have a good day,
emac
-
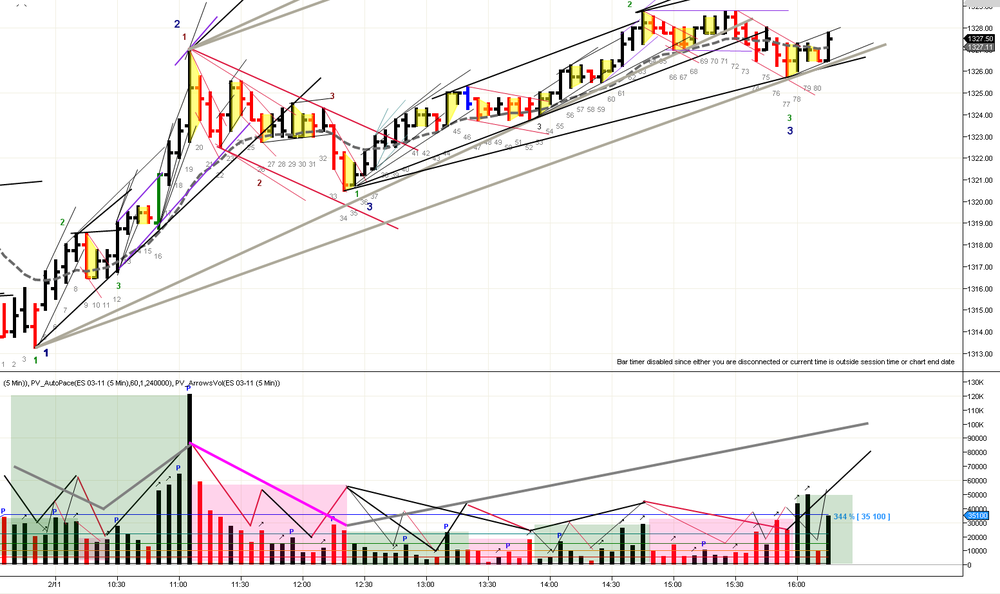
My attempt to annotate yesterday, which appears to me an elongated pt 3 move after the news. One which from the gaussians shows it is yet in the last leg up of a fanned the channel. I think Monday will confirm that observation of WMCN. I might have made a couple of mistakes in the lower fractal annotations which is not surprising with the slow pace in afternoon session.
-
And also on this chart, annotated by Spydertrader at the NY meeting.The vol in the 2b leg (from 12:15) is lower than the vol on the 2r leg (from 11:05 to 12:15) in the long blue container from 10:40.
Any thoughts?
When this seems not to happen I'm looking for a faster fractal, pace change, and / or an annotation error.Perhaps that is what cnms2 meant ?
-
Based on volume analysis, I believe that on your second chart the new up trend started at 11:00 (pt1), and its pt2 was still to come (so the down trend pt2 and pt3 at the previous flex points).In other words, based on gaussians being decreasing, the pink retracement sequence completed at 11:00 and it is not a R2R of a higher fractal as earlier indicated by jbb's chart. And the reason it is not a R2R is we have a pt 2 formed at 9:45 that broke the earlier green RTL. Correspondingly, no R2R is possible since there is no higher fractal RTL on the chart (which means what is occuring at that point of time must be still within a yet higher container or fractal).
-
Gucci,
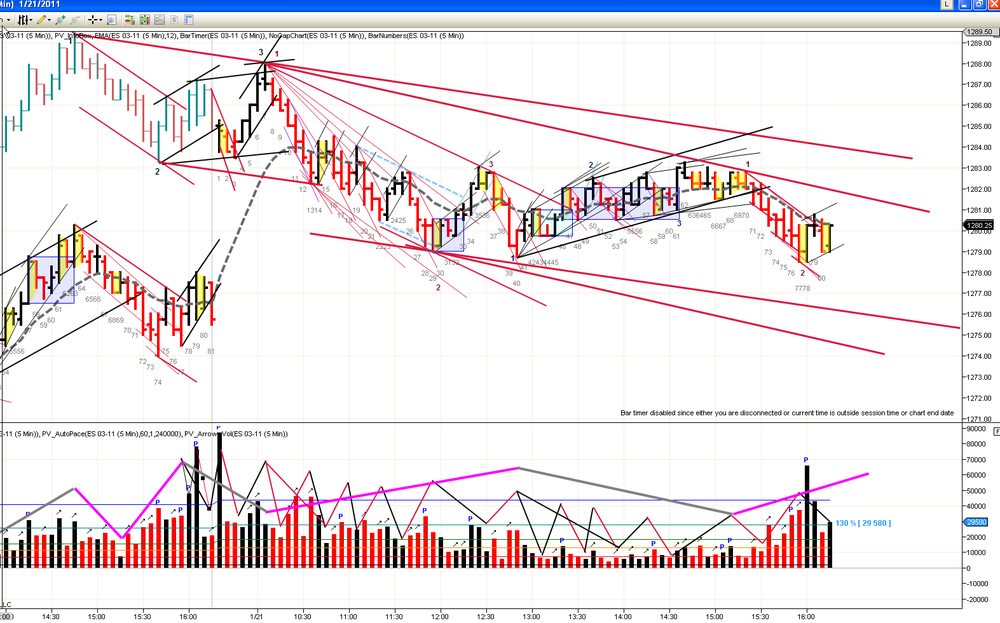
Friday 21st Jan had a move similar to your fractal drill last Nov. It is not exactly the same but had the elements of an R2R being ended at bar 29 instead of bars 12, 18 or 22 although at first look, each of them had the elements of ending the R2R i.e. return to dominance with increasing red bar after a black decreasing volume retracement.
All 3 had a common factor that the decreasing black volume retracements had no visible proper 1-2-3 move on 5m chart.
In your drill, if I understood correctly, the R2R was created via faster fractal move hence the next dominant 2R move would anticipate a similar faster fractal which explained the point 3 later at 10:55 in that chart snippet. On last Friday's chart, an R2R was created and broke the black rtl and a point 2 formed on bar 12 outside the rtl.
On Friday's chart, using a faster fractal move, what is the process of differentiation to allow me to correctly annotate each 2R move such that I will arrive at the final R2R bar 29 ? Using the same logic, I would have my first R2R ending at bar 18, then with another 1-2-3 move to end the next dominant move at bar 29 but the market has proven otherwise to end at 40.
TQ
emac
-
But I'd bet the YM or a finer ES level would show the sequence ending on bar 12 or 13. So however you view it, there is a 2b for some fractal, but it's below the level you were looking for.21 - 27 however has the full visible non dom volume sequence.
So yeah, looks like you got it.
Not familiar with the finer ES tool, looking at the YM, yes, it is there. Thank you !
:thumbs up:

-
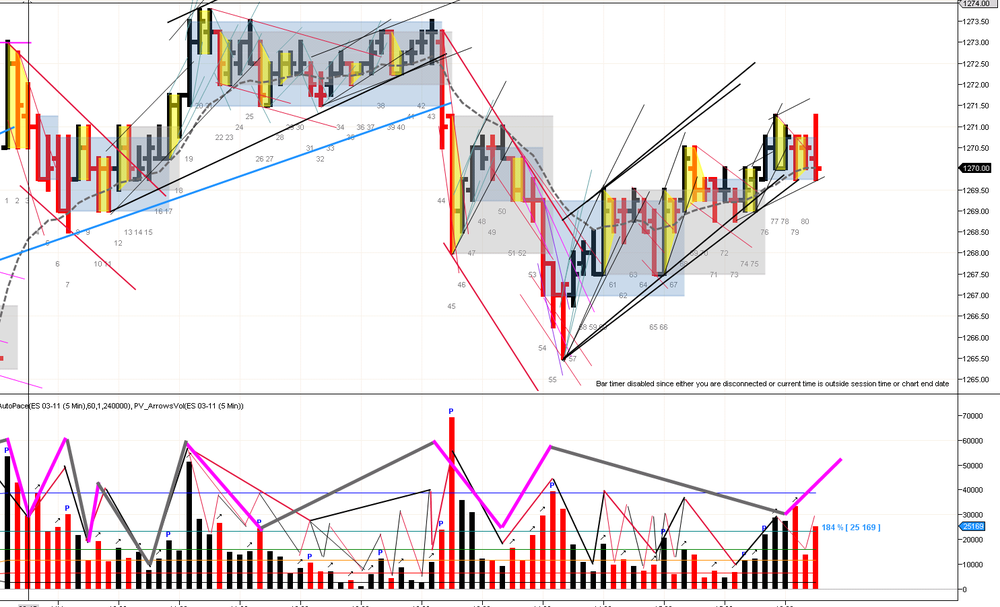
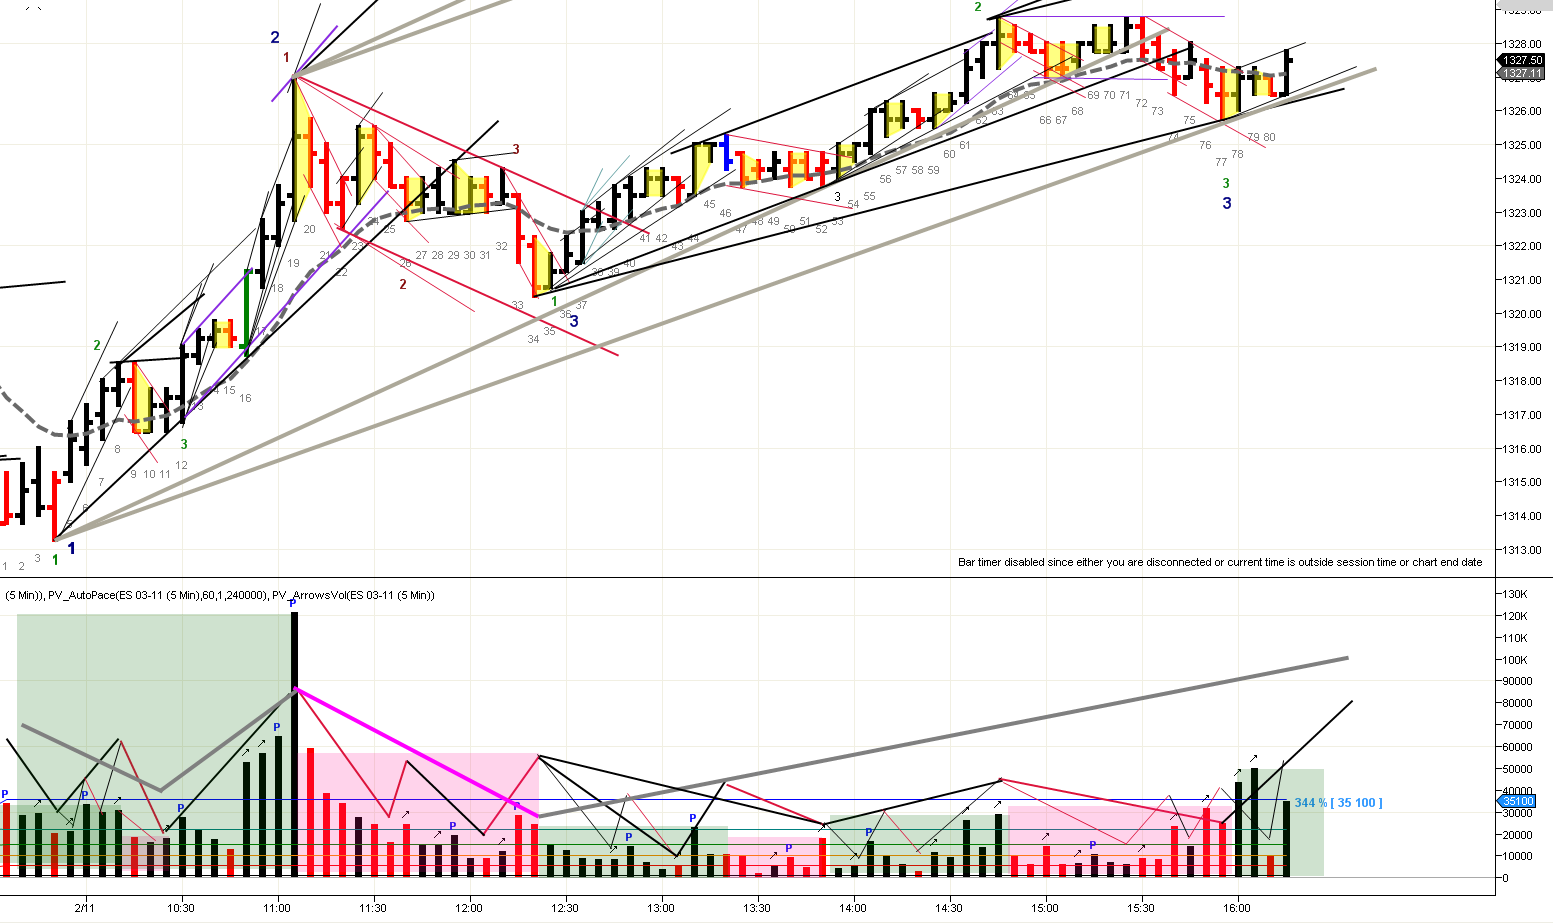
My view of the day, corrected after RTH in pink and grey to see the turns and forks better. Still many errors and I will need to do a detailed differentiation on the turns and forks.
I have a question - in order to stay in the same fractals, is there a way or particular thing to keep in mind at all times e.g.
1. I originally annotated that the 2R retracement (bar 21 to 32) ended on bar 32 but reviewed later to see that it should end at bar 26
2. bar 61 to 65 revealed a faster fractal gaussians, at that point in time, my mind was telling me my B2B from bar 56 to 60 MIGHT be a 2B retracement being completed , and the final 2R move is on the way with a BO r2r bar 65. The only signal I see was volume was low. So in order not to jump a fractal and maintain the outlook that bars 61 to 65 is but a faster fractal, what must one do when monitoring the volume and gaussian pane ?
TQIA
-
Look at the volume in your 2b's. They are different. Also look at the price movement, but mostly your volume sequence.
OK, thanks . Relooking at the 2b again, bar 11-12 was a stitch long creating a possible b2b with the increase in black volume. If that was the case, then bar 13 should be point 2 to 3 with decreasing red. Instead bar 13 had increasing red indicating that a change in dominance had occurred and the sequence is not completed yet.
The 2B from bar 21 is full sequence non-dominant move from bar 21 to 27 with a decreasing volume to create Point 3. Bar 28 confirms WMCN with Point 3 move.
Am I close ?
-
Compare your 2b following bar 10 with the 2B following bar 21.Also looks like you have the old lateral movement code on your charts. It's no longer used FWIW.
Can it be that the 2b after bar 10 occured in a Lateral Movement, in which bar 10 in itself is also a non dominant bar. Hence the sequence has not completed by bar 10. By contrast, the 2B after bar 21 occured after dominance has returned at bar 20 (am I correct to observe so on this bar 20?) in which the sequence has completed.
This is the code I have to date. I notice it doesn't draw the LM correctly as per my understanding. If you can kindly point out where I can locate the newer code, that would be very helpful.
Thanks for the pointer.
-
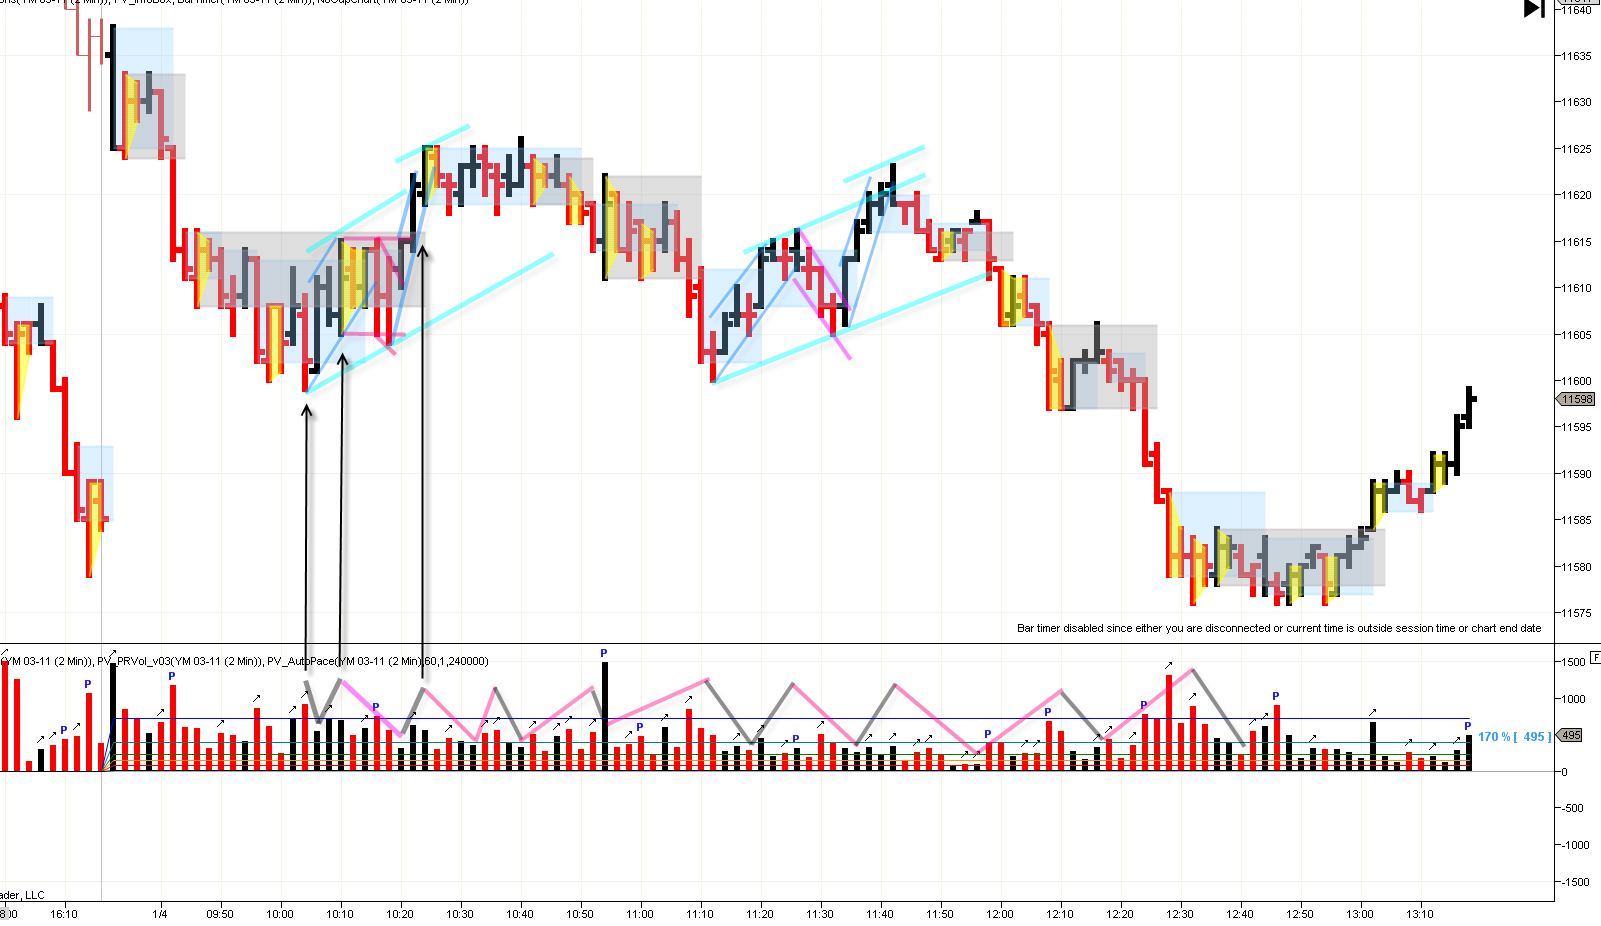
My view of the day. The R2R ended at bar 21 on my chart, although I had mistakenly taken it to be at bar 10 earlier , only to see the market prove me wrong. So I do not know the reason why as yet why the sequence has not complete at bar 10.
The market showed on debrief that a r2r2b2r faster fractal traverse was in place that ended at bar 10. Then 2B and 2R to complete first move down to bar 21.
I see the gaussians, but I do not fully understand or comprehend what they tell me. Would appreciate if someone point the way how to better recognize these road signs as they appear ? In order words, the market must leave clues to tell me that it has not reach completion. I know there is a missing link.
TQ
-
From me too ... here's wishing everyone a happy and successful 2011:)Let me add, to everyone, good health and success and a Blessed New Year.
-
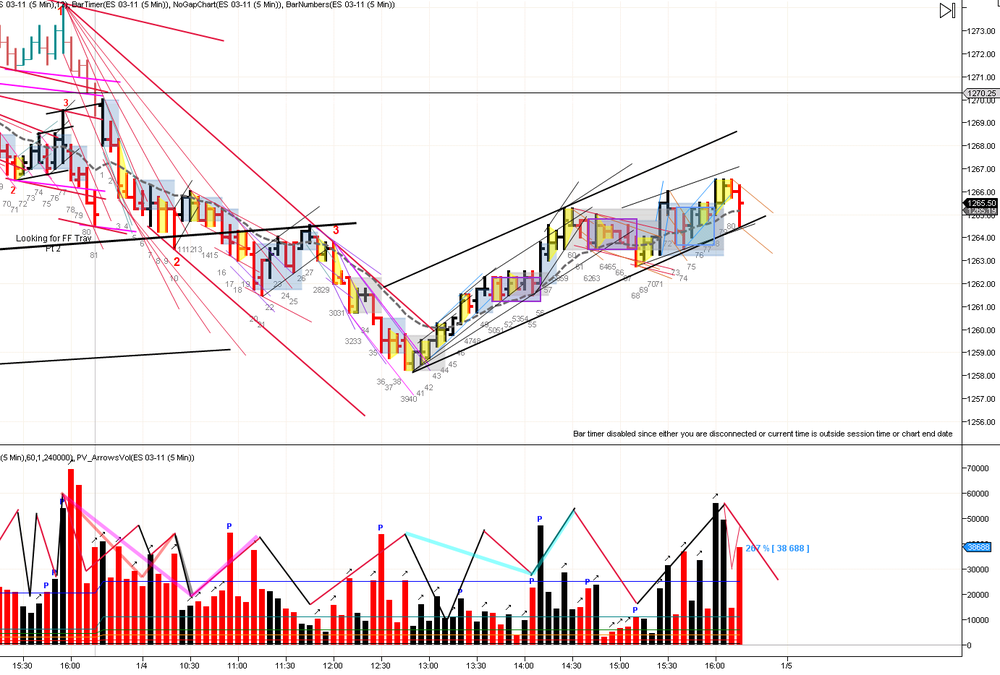
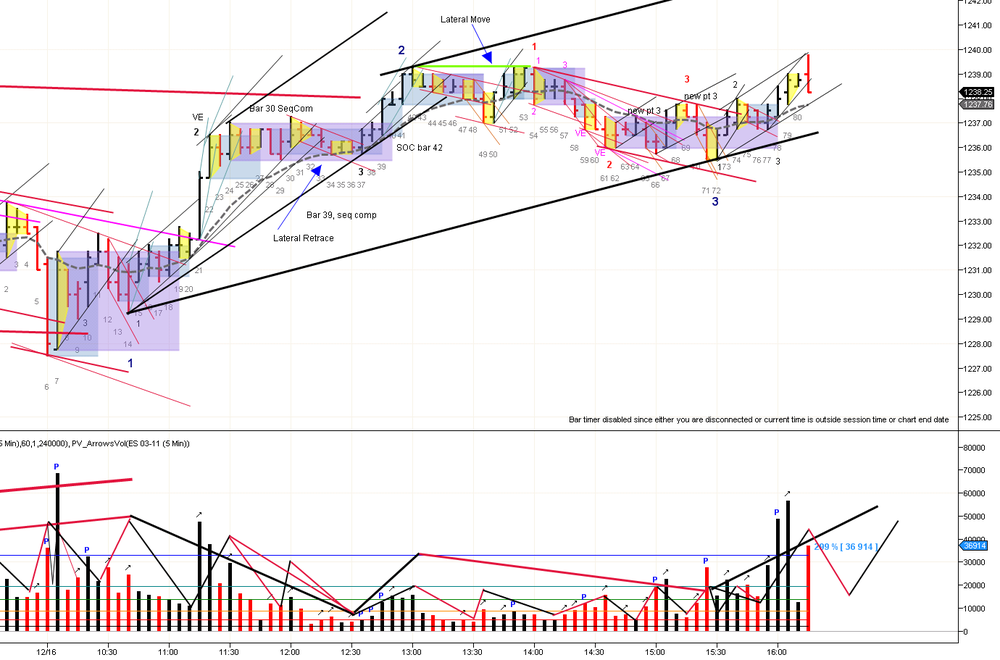
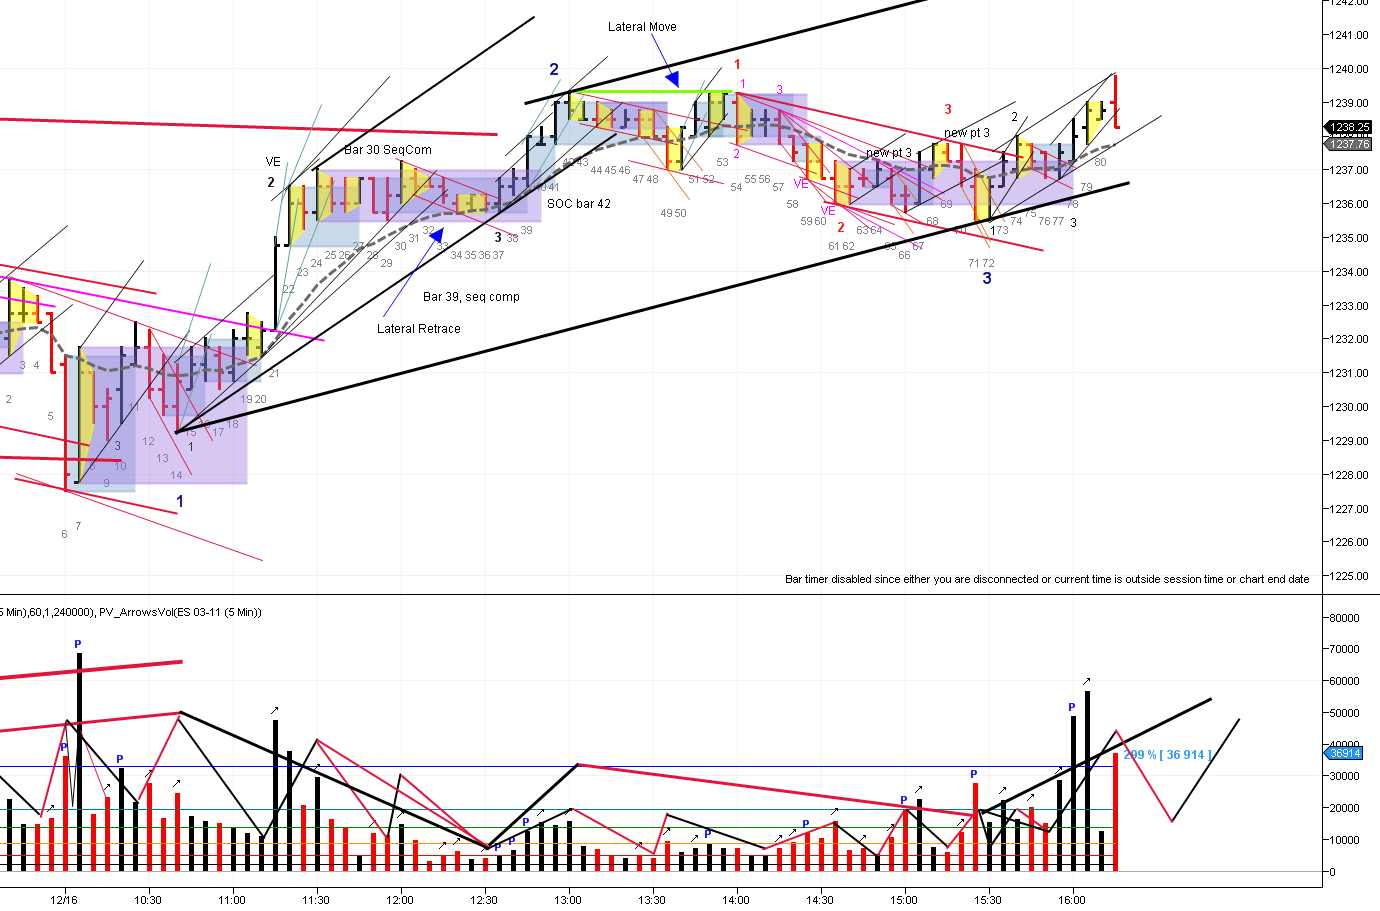
My view of the day. The drill follows sequence completion, then SOC and repeat. It appears to me that the medium black traverse ended at bar 42 in my chart and I annotated a R2R based on volume pane gaussians as the previous container RTL had been broken. May I ask if this is correct interpretation since it happened on a lateral movement ?
The other tough period was the afternoon's lateral formations and movements. I tried to use the volume to determine the sequence as much as possible and hopefully am moving in the right direction.
-
If the volume's through of the x2x move (pt1 to pt2) happens where the price crosses the previous container's rtl, then the pt2 of the new container must be outside the previous rtl.Thanks cnms2, for the clarification.
Vienna, if I may add, I had mistaken the blue container sequence completion at 13:25 in the chart referred to in that post . Gucci's precise annotation showed the sequence completion at 13:50. I had also failed to see the VE after the point 3 of the blue container which should have alerted me that the sequence is yet uncompleted. After the final sequence completion, a new R2R would have to have the pt 2 outside the previous blue container.
TQ for the question.
-
Here is the "precise" version.Thanks, Gucci for the chart. I totally forgot that point 2 must be outside the previous RTL and hence my earlier R2R was invalidated with the traverse ending 1350.
-
Hi emacAccording to my understanding, if you have a faster fractal b2b2r2b establishing the first dominant leg of a traverse (B2B) and taking you to the traverse point 2 (as here according to cnms2), then you should anticipate a similar volume sequence (b2r2b) in the second dominant leg of the traverse (from the traverse point 3). As this second volume sequence has not completed at 1325, I don't think that your r2r is valid as this implies change in dominance and we don't have permission to look for change until the faster fractal volume sequence of the 2B (from point 3) is complete.
I have tried annotating some more faster fractal traverses.
What I find interesting is that after the blue traverse container under discussion, the R2R annotated does not consist of a faster fractal r2r2b2r (at least not one that I can see). It is as if the market "jumps fractals" - I seem to recall Gucci using that phase:)
But this is followed by a faster fractal r2b2r for the second dominant leg 2R (from point 3).
Hi 203NG,
Thanks for the notes. This is how I see it though working on the bar dominance and sequence. I see completion at 1325 that created the point 3 for the thick red channel. The B2B broke the pink traverse and point 2 of the blue traverse created from lateral retrace at 1315.
emac
-
Thanks so much for your response cnms2.Would the attached gaussian annotations, (fraster fractal and traverse) be more accurate?
It looks like the dominant 2B ended 1325 followed by a r2r pt 2 at 1335. followed by non-dominant lateral that ended at 1400.
-
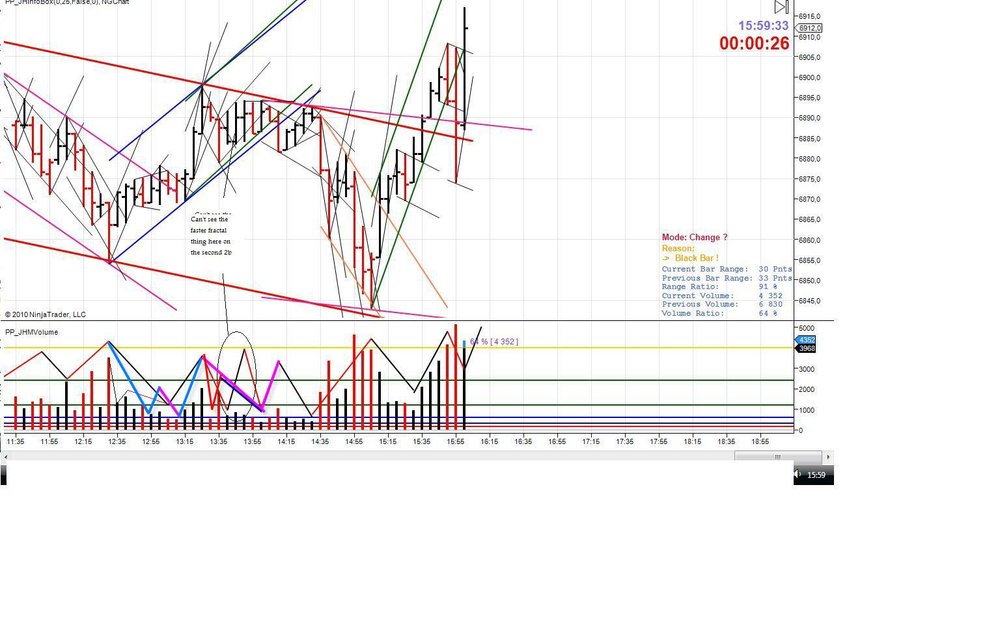
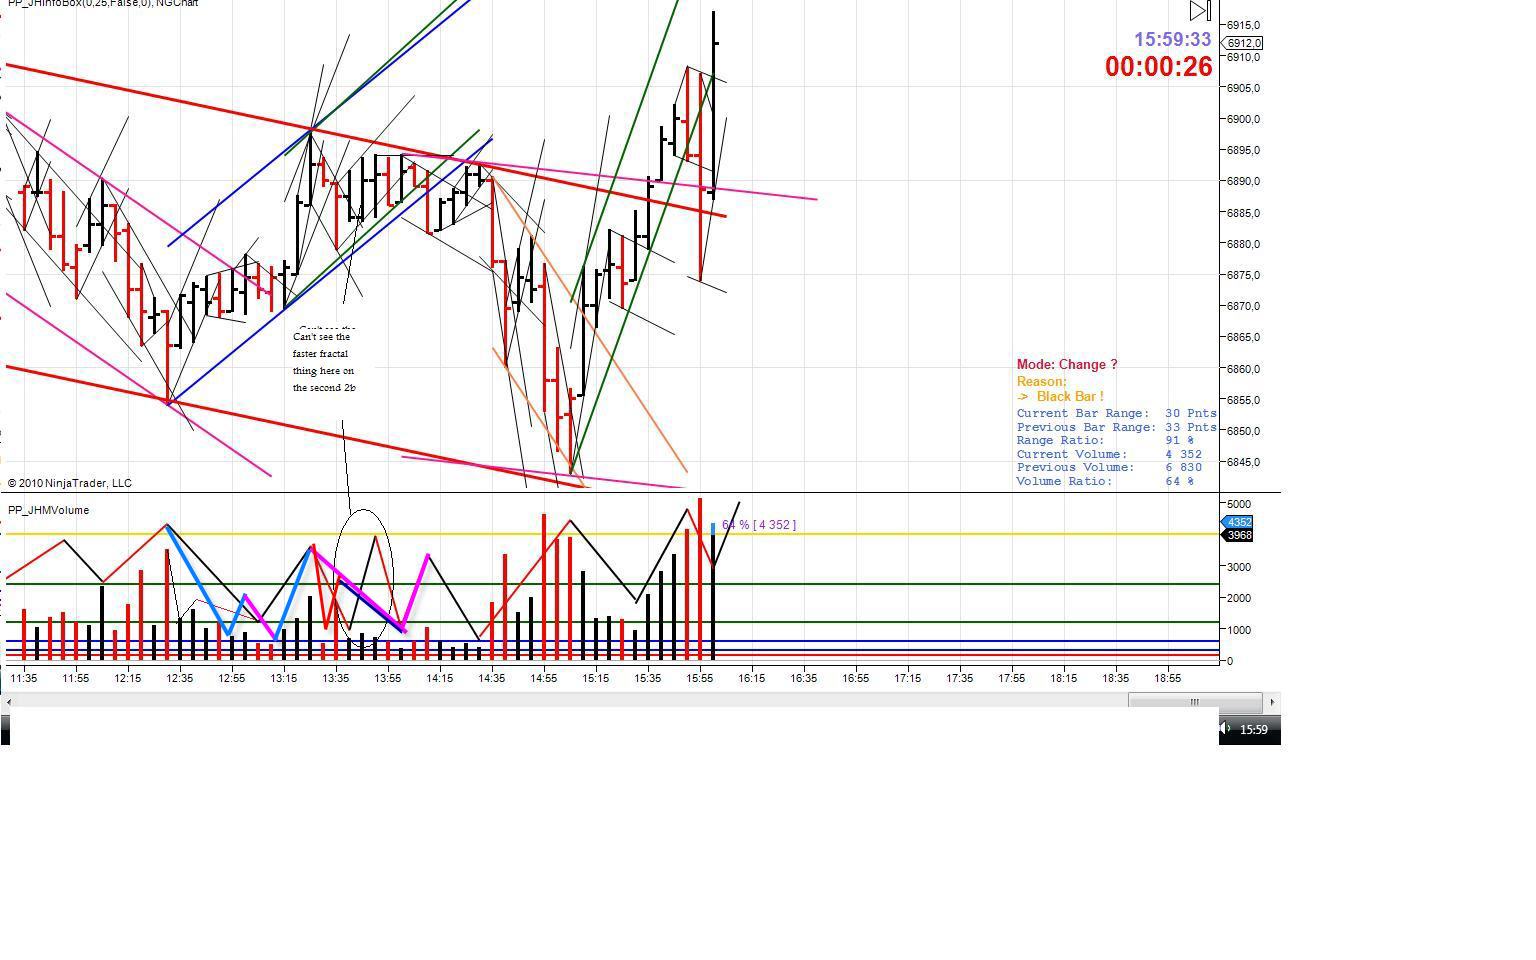
Thanks gucci for the reply and the question. If you want to know absolutely that the thing in the deep pink lines is over, you must go to the 1610 bar for the completion of the B2B and the increasing black volume of the dominant bar. However, I see that there were clues prior to that, at 1545, increasing red vol completing the sequence of the pink thing, at 1550 an OB on increasing black Vol which breaks the RTL of the pink thing and signals to anticipate change.TQ SScotts.
Following the IBGS , it looked like FTT FBO BO is being played out for the B2B to complete.
-
The explanation is actually much simpler than you think.In the attached chart for instance, at what point in time can you be absolutely sure that the thing confined by deep pink lines is over?
At the completion of B2B at 1610 hrs BO of pink RTL with increasing black vol ?
-
LOL. :rofl:Good one.
Sorry, i meant to laugh at Tam's quote "newbie: WTF is happening?
exp: WTF, it is happening again !?!?!" ....
-
.......... ..........LOL. :rofl:
Good one.
-
The sequences always complete. Now take your answer and try to draw the tapes your suggestion implicates make the sequence complete.You didn’t really pay attention to what had transpired in the volume pane, did you?
Gucci,
Thanks for commenting on the reply. I looked at the vol that created the 1st VE in question and saw the faster fractal b2b2r2b.
The idea of the drill was to show two different types of VEs. The first one lets you anticipate a new point 3. The second one doesn’t. Jack explained that very thoroughly in his post, link to which was posted by cnms2 in this thread.Funny how the chart of Spydertrader with two VEs didn't evoke much interest.(the chart Spyder posted in this thread)
Ok, I understand and see that. Can you kindly tell which chart of Spydertrader are you referring to above as well as the post by cnms earlier. I seem to have some trouble looking it up.
Let the market falsify your hypothesis. The sequences are always complete.Spydertrader once asked how do I know I would arrive at the destination. I didn't really know how to answer him then as I was baffled.
Now it seems the process of learning to recognize the signs on the journey are probably the key and in the context of each fractal, the ability to see the sequence completion is needed before the next begins. Whether a new point 3 is anticipated will very much depends on the ability to see the 1-2-3 which must be corroborated by the volume gaussians. If this analysis is correct, then my M-A- will be one level up to stay on the right side of the market.
Thank you.


The Price / Volume Relationship
in Technical Analysis
Posted
Hi patrader,
Are you referring to the same chart in gucci's #2718 post ? If so, bar 58, which should be at 2:20 pm (EST) - it is showing dbv and not bo of the dark blue channel. So I am not sure which chart are you referring to or the time on the chart is not on EST ?
TQ.