
Welcome to the new Traders Laboratory! Please bear with us as we finish the migration over the next few days. If you find any issues, want to leave feedback, get in touch with us, or offer suggestions please post to the Support forum here.


double eagle
-
Content Count
12 -
Joined
-
Last visited
Posts posted by double eagle
-
-
Thank you Spydertrader for the feedback.
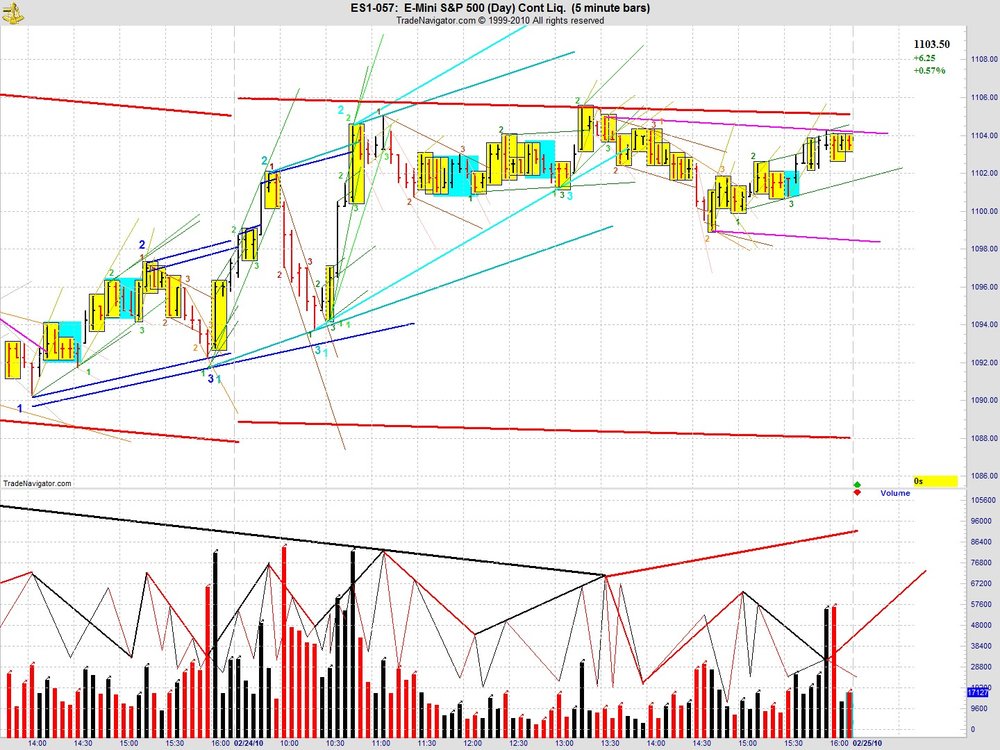
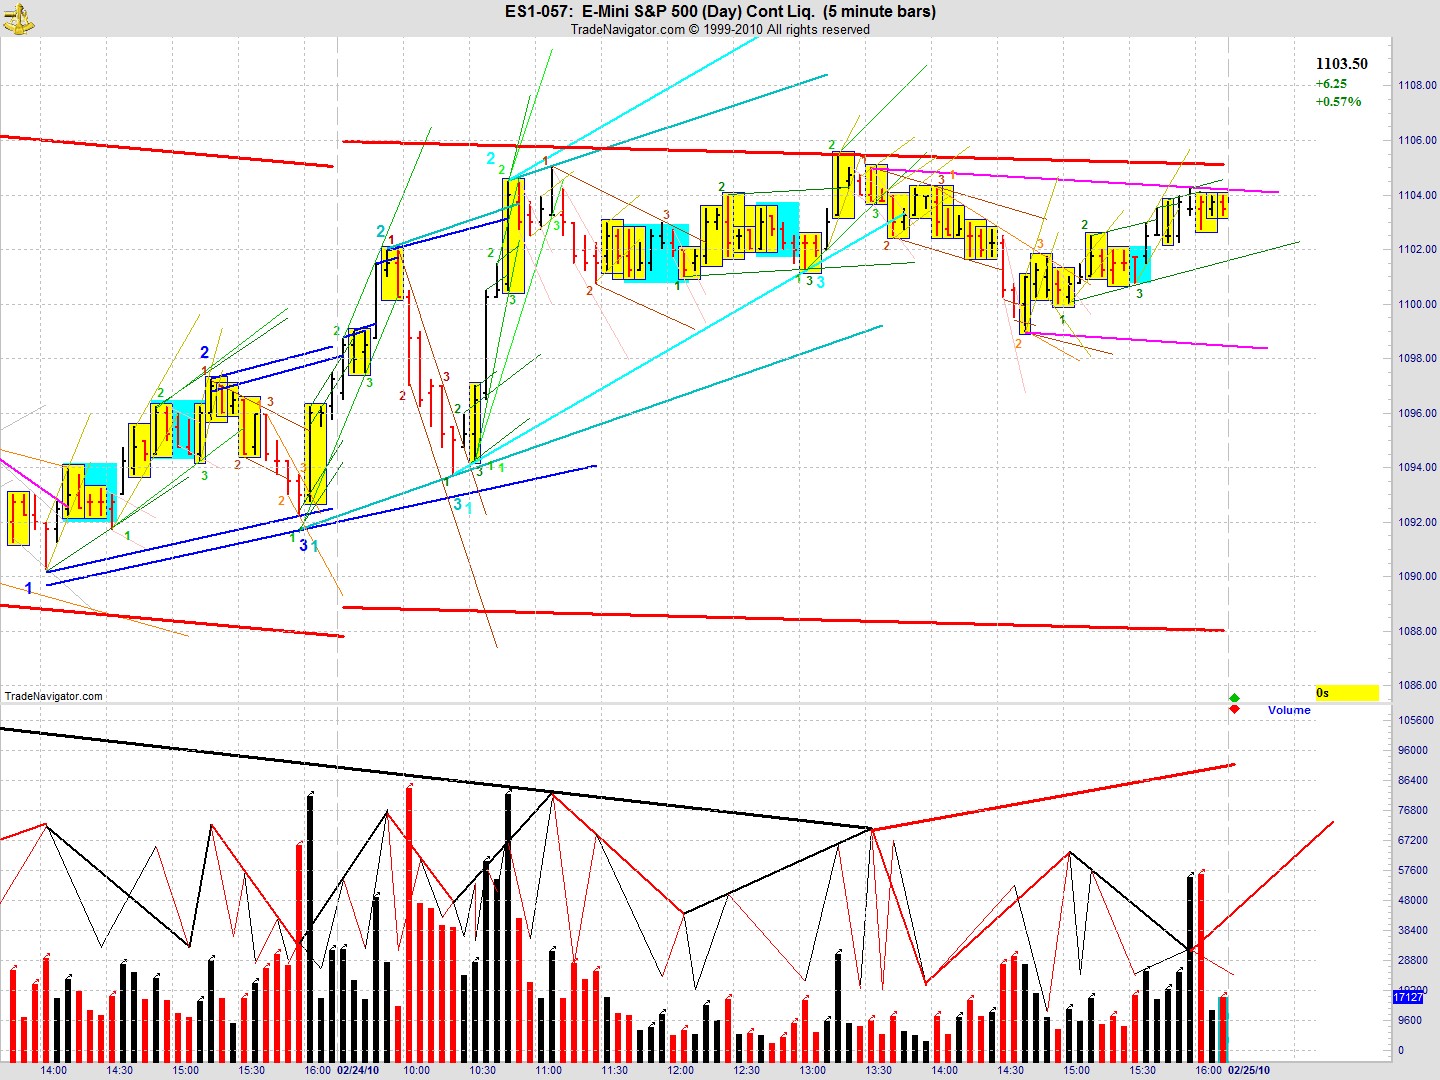
Here is a second version of my 02/24/2010 chart. I removed the automated laterals and drew the laterals that I hypothesized would help me draw my guassians. I also attempted to come up with a better coloring and numbering scheme to provide clarity. You'll note that I made quite a few changes to the guassians as I tried to correct my nesting of fractals. Hopefully, I made a step in the right direction. I will know fairly quickly when the market opens if my medium weight pink trend (from 13:35) is going to be invalidated by a bar that goes above the gap adjusted 13:35 bar.
-
Here's my chart for 02/24/2010.
-
Five.- Spydertrader
The 5th one has bar 1 at 13:35.
-
Hi Ezzy and Spyder. I am going to throw my opinion into the mix here. I think what Spyder is trying to get at is that there are different types of laterals that can be grouped based on how the boundaries are formed. I am not saying that this is the only way that laterals should be grouped, I am just saying that it seems Spyder is pointing us there as a one of the focuses of the discussion.
This is much like how pennants are grouped. For pennants we have FTPs which have a boundary at the top (second bar high equal to the first bar high), FBPs which have a boundary at the bottom, SYMs which do not have a boundary formed by the 2nd bar, and EHs which have boundaries at both the top and bottom. The FTPs and FBPs have directional components to it (you can draw a trend line), the SYMs don't, and the EHs have a lateral trend associated.
I am thinking that Spyder is saying let's look at laterals that have the boundaries at the top (like a FTP) or bottom (like a FBP) and differentiate them first. Then we can move on to ones that don't have a bar that set the boundaries (like a SYM pennant) or boundaries at both (like an EH).
Laterals that have a boundary at the bottom can form in 2 ways. One way is for it to begin as a SYM and then have a subsequent bar set the boundary. The other way is for the lateral to begin as a FBP. Those are the only two ways that are possible. The way that they accomplish the task is different, but the function is the same. This is like having two different kinds of hammers. In the end, the function is to pound a nail into wood even though there are other differences between them. The same logic applies to laterals that have a boundary at the top.
There are other laterals that do not have a boundary setting bar (equal high or low of a subsequent bar compared to the first bar). They start out as SYM pennants. The subsequent bars don't set a boundary. Eventually one of the bars BOs of the high or low of the first bar (no bar closes with an equal high/low to the first bar). So we see a difference. It's like the difference between a FTP that BOs on the third bar and a SYM that BOs on the third bar. One had a boundary, the other didn't prior to BO.
Finally, there are laterals that have boundaries on the top and bottom. They start out as a SYM pennant, some bar later sets one side of the boundary, and then some bar later sets the other side of the boundary. This is like an EH.
I am going to throw a wild off the cuff thing out there and say that if you broke down a pennant by looking at a smaller time frame chart (whatever that might be) you would see a lateral that forms in the same ways as described above. For example, you would see a FBP form as a lateral on the smaller time frame with either the second bar or a subsequent bar creating the boundary (the two types of hammers I described above). I don't want to go too far down the rabbit hole. This is just an observation that I thought about.
So our job is to first look at context, then at the sequences, and then at the "thing". Just as not all FTPs are alike (volume can be increasing or decreasing, the open can be higher or lower than the close, etc.), not all FTP-like laterals are alike. We need to differentiate all the permutations.
With all this being said, I am trying my hardest to go through this process of differentiation and hoped that my post would spur some further discussion. I humbly must admit that all that I just typed could be rubbish... or there could be something to it. If there is something to it, I'm trying to figure out what is the market "tell" in each situation, how does that affect WMCN, which side of the lateral will price break out, does it create pt. 2 to pt. 3 of "something" or are we still on our way to pt. 2 of "something" as we exit the lateral, etc.
Sorry for the long post. I just wanted to get some of my late night/early morning thoughts out there to see what people thought.
-
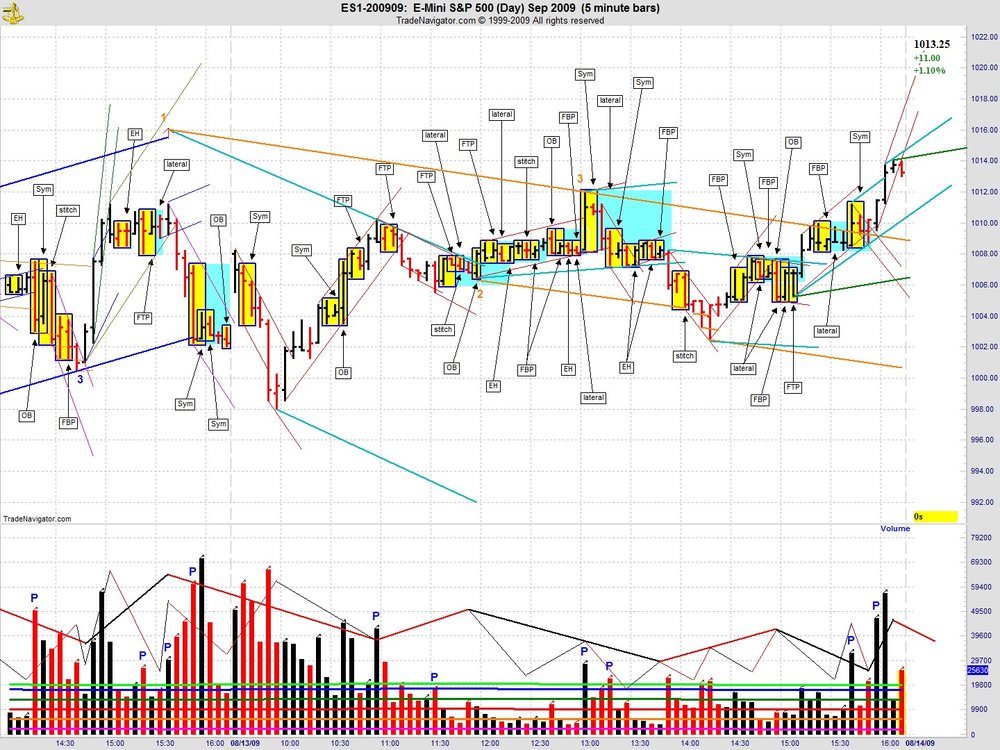
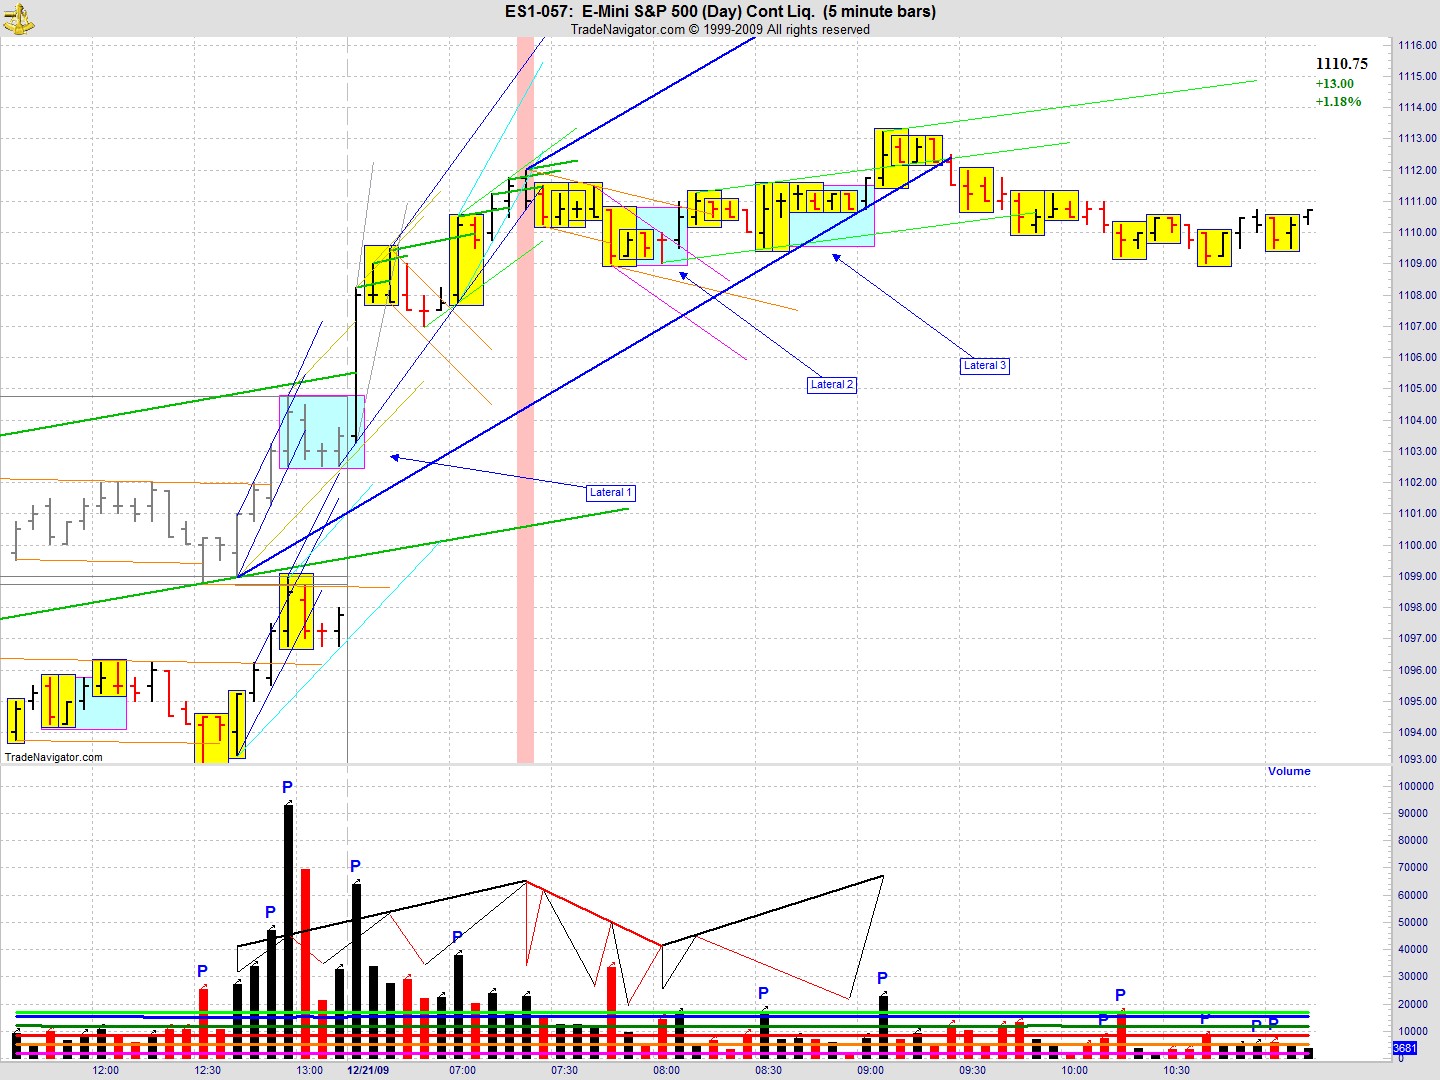
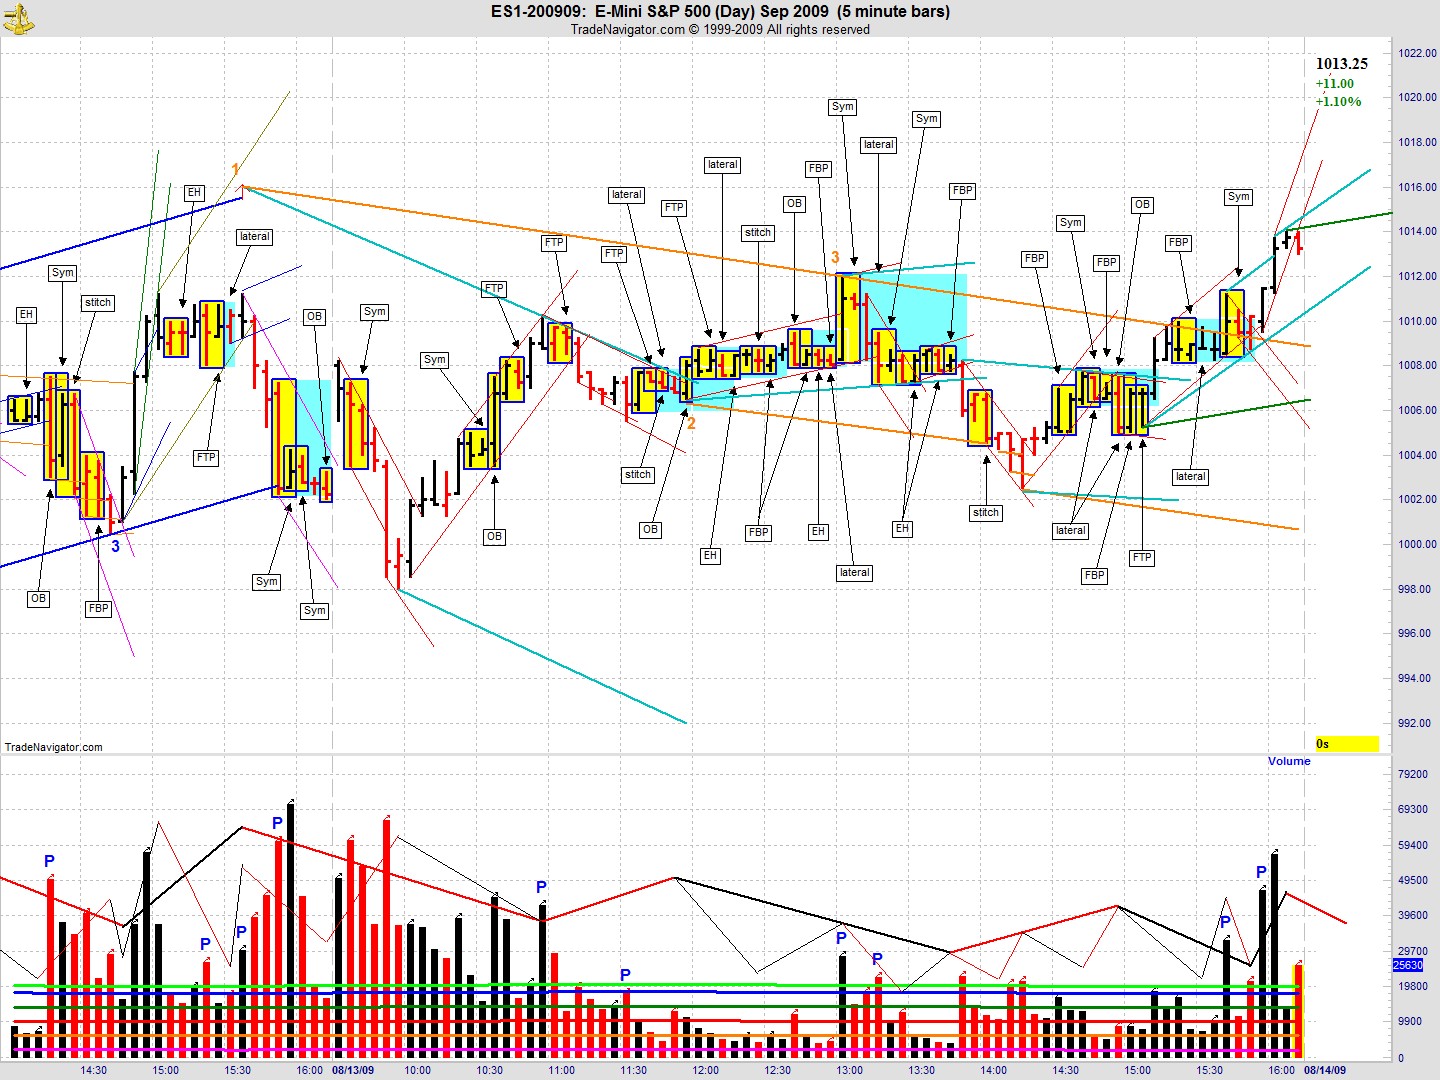
Here is my stab at it. These are some questions I asked myself when looking at the chart. The answers (ramblings) are a reflection of my current level of understanding and hopefully don't confuse others.
Q1: How could the laterals have been anticipated?
lateral 1: Volume accelerated to the highest volume of the day creating a peak. A lateral should be anticipated. On top of that this occured at 4:00 pm and the next bars usually have a volume drop off which would further make one anticipate that there wouldn't be enough volume to continue translating.
lateral 2: Pace jumped to extreme levels after volume drop from the market open. Anticipate a lateral as volume continues to drop off.
lateral 3: Pace accelerated creating a wide ranging OB, but the bar closed inside the previous bar. Anticipate more lateral movement with volume continuing to drop off.
Q2: Where are we in the tape/traverse sequence?
lateral 1: This is the third tape of the traverse (after pt. 3). The lateral is entered as we search for pt. 2 of the tape. This tape is later accelerated after pt. 3.
lateral 2: The original traverse is VEed. This lateral is part of the non-dominant tape that occurs after the VE. An accelerated traverse is being created. The lateral is entered after the pt. 3 of the tape.
lateral 3: This lateral ocurrs on the third tape of the accelerated traverse. The lateral is entered as we search for pt. 3 of the tape.
Q3: Can tape level change occur within the lateral?
lateral 1: No. We haven't reached the tape pt. 3 yet.
lateral 2: Yes. The tape pt. 3 has already been reached.
lateral 3: No. We are still moving laterally, looking for a return to dominance to confirm a tape pt. 3.
Q4: Is this a dominant or non-dominant lateral?
At my present level of understanding, I see non-dominant laterals as ones that create pt. 2 to pt. 3 movement. I see dominant laterals as ones that create pt. 1 to pt. 2 movement or post pt. 3 movement.. Hopefully this terminology doesn't contradict the working definition layed out in this thread and what was presented in Vegas.
lateral 1: The first bar made a HH in the dominant tape direction. However, it did it on volume that peaked with an acceleration of the gaussian slope. Therefore, I view this lateral as beginning with a signal for change on the sub-fractal level which creates pt. 2 on the tape level. I view this as a non-dominant lateral which creates pt. 2 to pt. 3 movement. Anticipate a BO up and into the trend post tape pt. 3.
lateral 2: The first bar made a LL in the dominant tape direction post tape pt. 3. I view this as a dominant lateral that can have a tape level signal for change in it.
lateral 3: The first bar was an OB on increasing volume. However, it closed back inside the previous bar. Price hadn't finished moving laterally. I view this as a non-dominant lateral that continues the tape level pt. 2 to pt. 3 movement. Anticipate a BO up and into the trend which creates a tape pt. 3.
Q5: What does volume tell us inside each lateral?
lateral 1: decreasing non-dominant volume, followed by increasing dominant volume that takes us out of lateral. This is what is anticipated. I assume that there is a complete non-observalbe (on the ES 5min.) sub-fractal r2r2b2r within the lateral that gives us the 2r of the tape volume sequence. I know the sub-fractal sequence has completed once there is a return to dominant volume within the lateral.
lateral 2: The 1st bar was followed by decreasing non-dom volume. The fourth bar was a return to dominant red volume. However, the bar FBOed the EH signalling change within the lateral. I view this as the accelerated tape r2r2b2r completing in the lateral. Next, increasing red turned to increasing black (change in dominance) and the accelerated tape was BOed. Therefore, volume telegraphed a tape level change within the lateral.
lateral 3: decreasing non-dominant volume followed by increasing dominant volume that takes us out of the lateral. The sub-fractal r2r2b2r though not observable, must have completed with the return to dominant black volume.
Q6: What role do the VEs seen on the first bars play in the laterals?
lateral 1: the sub-fractal trend VEed on the first bar of the lateral. The non-dominate and then dominate sub-fractal movement following the VE can be unobservable on the ES 5min.
lateral 2: The down tape was VEed on the first bar of the lateral. I anticipate non-dominate then dominate movement. This accelerated tape movement completed with the EH FBO on increasing volume.
lateral 3: N/A
-
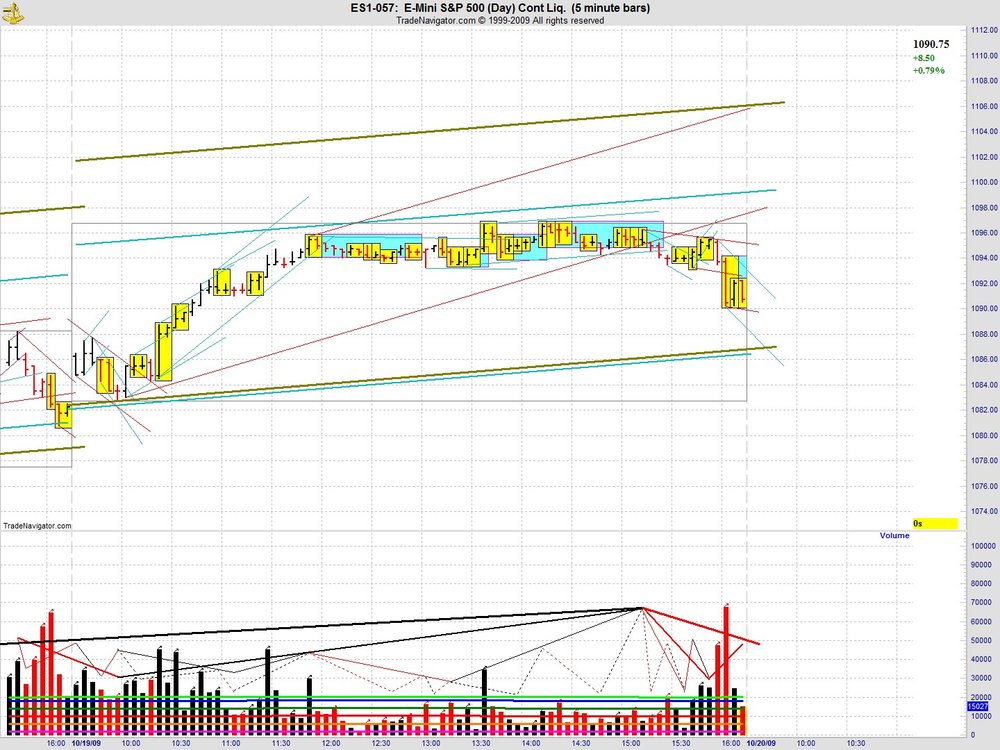
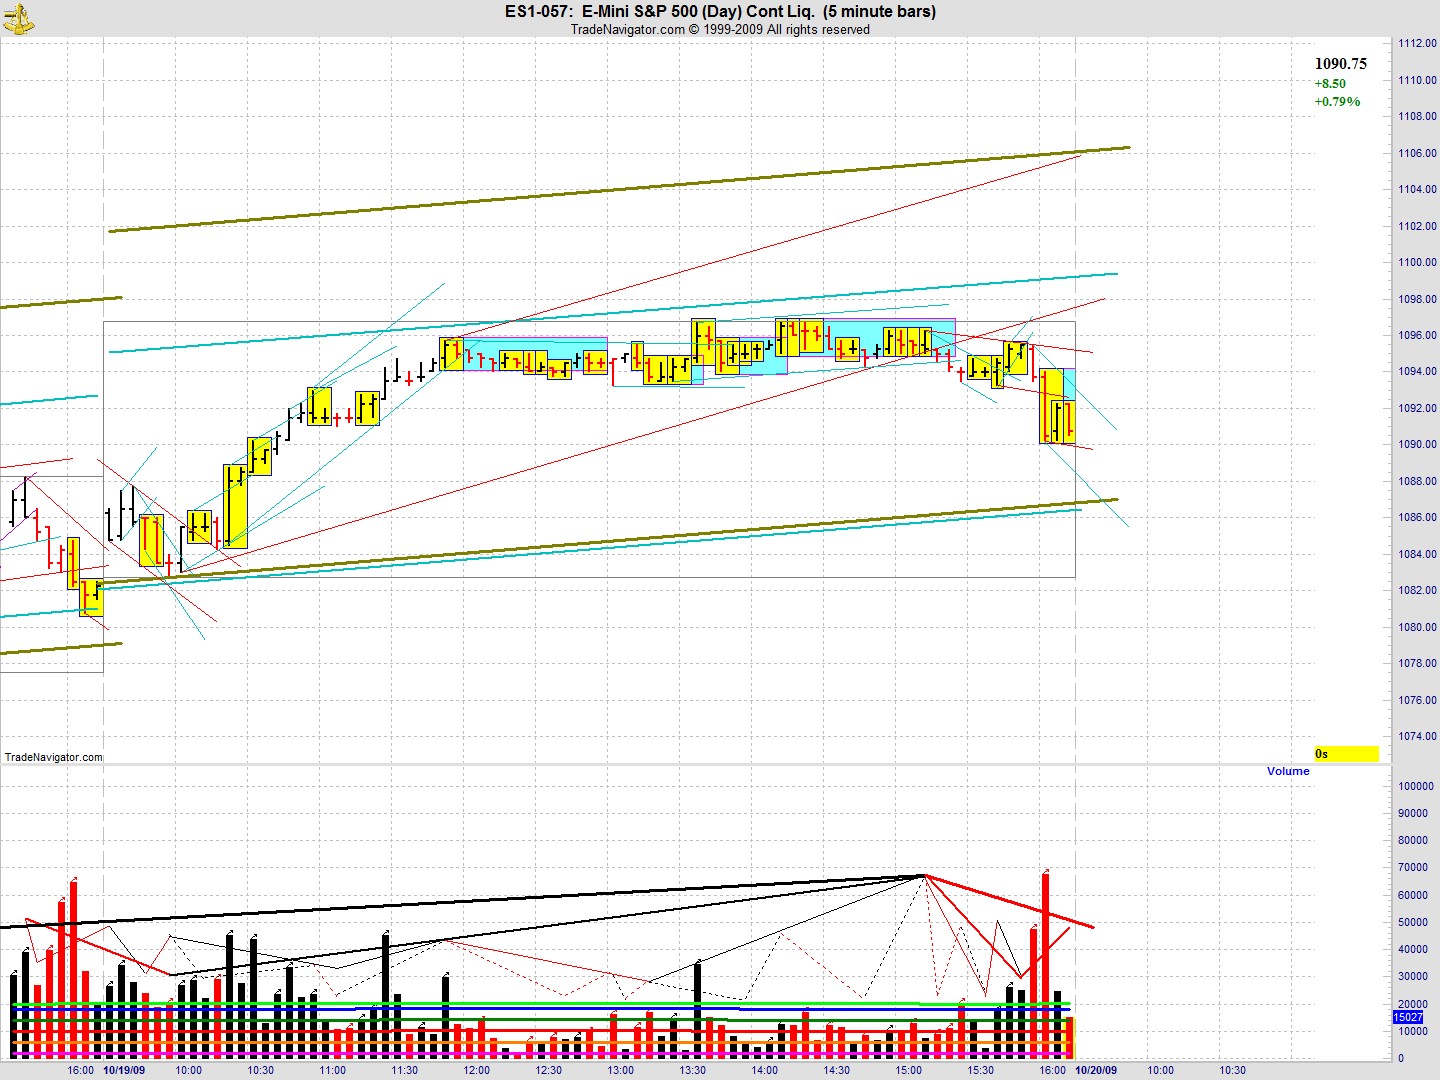
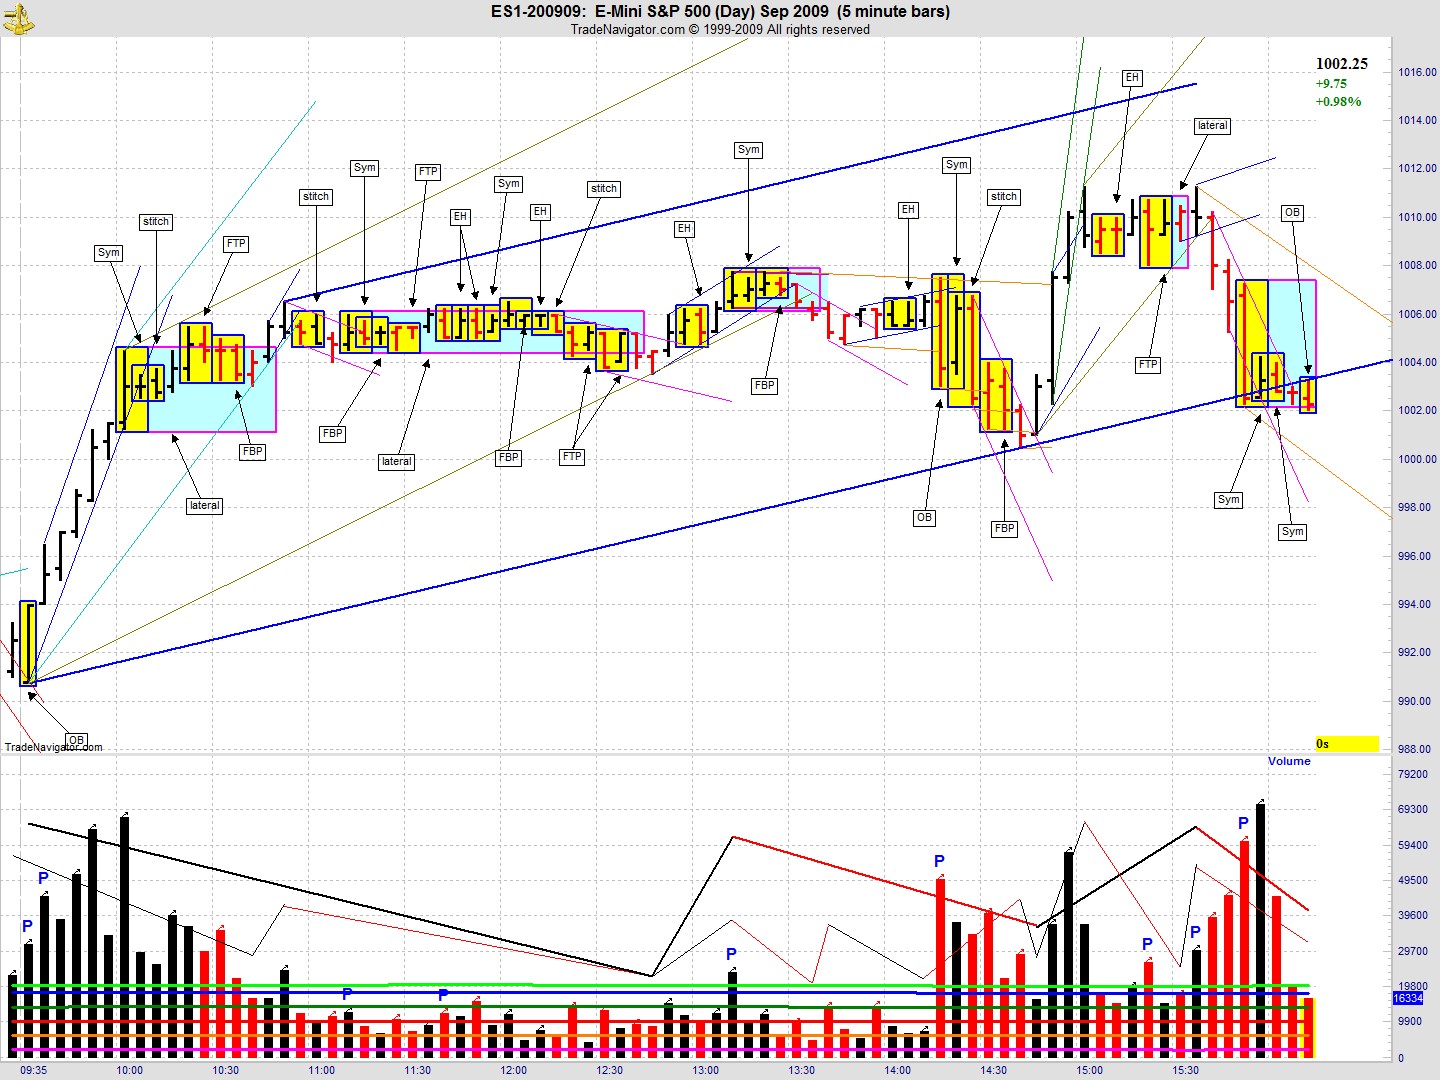
Here's my work for today (10/19).
-
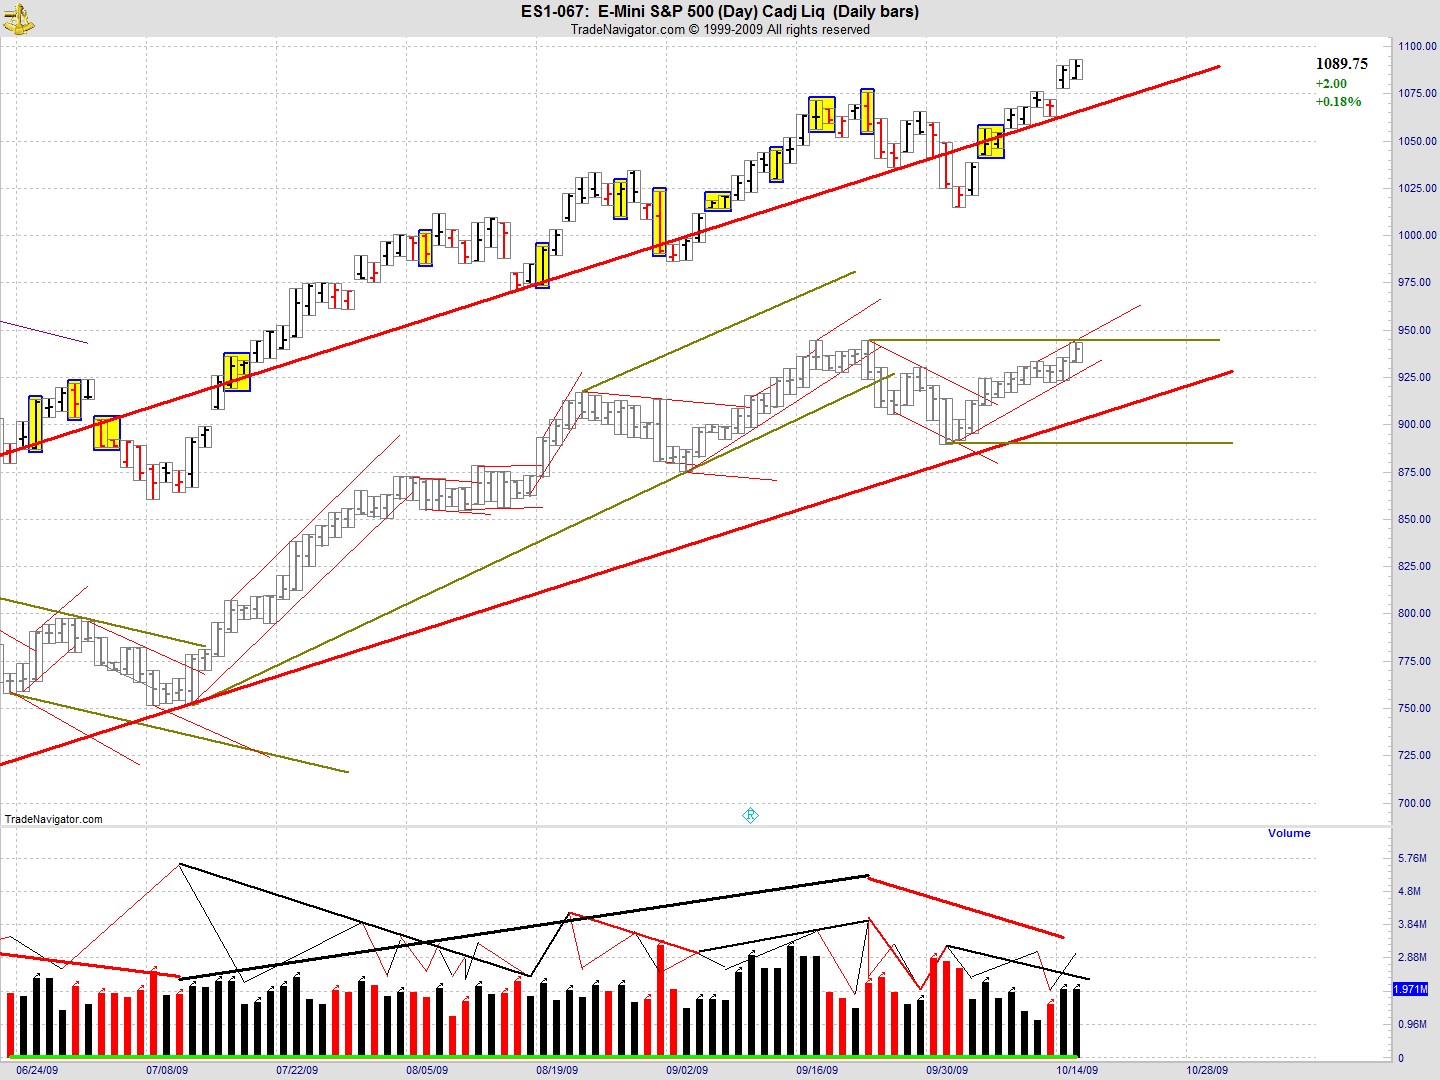
Here is a daily view that I have been working on. The normal daily bars are on the top of the chart. The grey bars in the area below are generated by the copy pattern drawing tool in TN. I used this to remove the overnight gaps manually.
We are at an interesting point on the daily. I've annotated that the market is searching for a point 3 of the current green downtrend. We are about to CP4 as Jack has euphemistically described the point where the prior trend FTT is passed when looking for a point 3 of the current trend. A CP4 would cause me to fan the green uptrend that originated on 7/13. I must say, this bear market rally (red uptrend) is sure persistent.
One question for those following the thread about the MADA loop. When we FTT a trend, we want to see the dominoes fall and one by one eliminate the possibilities of WMCN. We want to see the following in order:
1. sequence completion
2. an FTT with a signal of change
3. decreasing volume to the RTL
4. increasing volume on the RTL BO and into the trend towards point 2
5. decreasing volume on the new trend retrace in the search of point 3
Can we rule out a CP4 at any point of the above points 1-5? My current understanding is that you can't and that is how I am interpreting CP4. What are people's thoughts on the subject. Here's a link to the clean page 4 I alluded to that shows the new point 3 region in bright blue.
http://www.traderslaboratory.com/forums/34/price-volume-relationship-6320-3.html#post71050
-
I created the carry over thick green and medium blue trend lines by piecing together 5 minute charts for the current channel with the gap removed. I did the piecing together on another part of the chart not shown (like a scratch pad area) using the copy pattern drawing tool in TN. I then duplicated the trend lines over to the current day. The thick green RTL began on 10/1 at 16:05. The medium blue was from 10:30 yesterday.
-
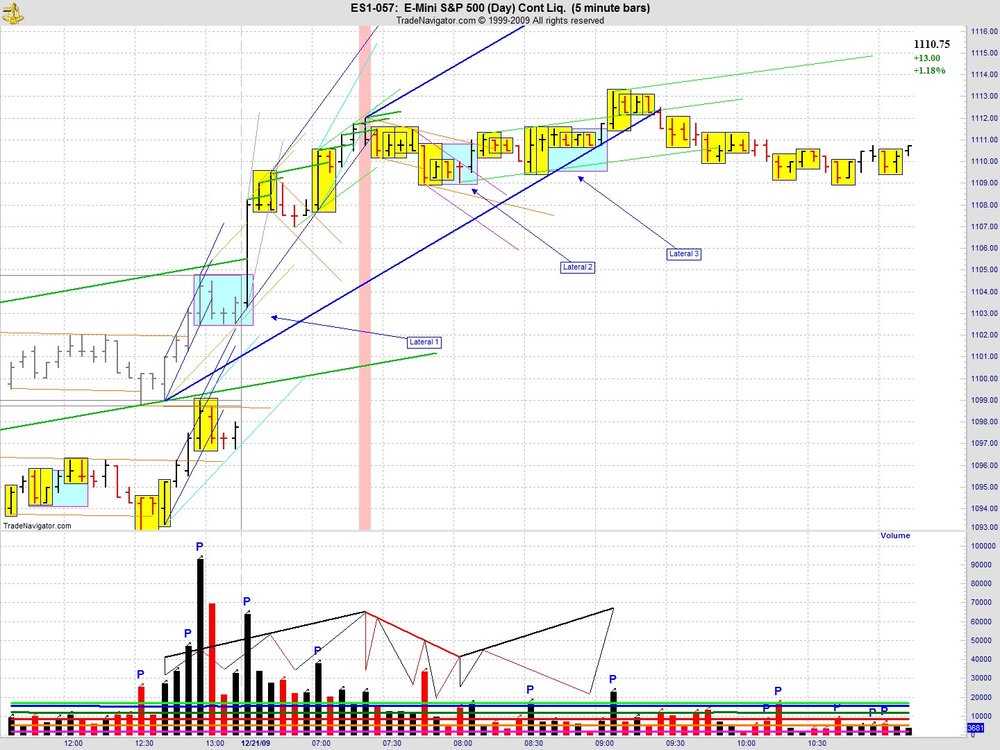
Here's my effort for the day. I tried out placing point 2 of the traverse at the point of volume sequence completion (12:00 today) as discussed yesterday. It does aid in "seeing" the volume sequences when looking at the price pane.
I also made a concerted effort to annotate trendlines in a consistent way (line thickness, color scheme) in order to better see the markets sequences. I hope you don't mind Ehorn, but I borrowed your coloring convention.
Also, my placement for point 1 of the down traverse is of note (15:40 bar yesterday). I arrived at it by removing the overnight gap mentally.
If I didn't remove the gap, the 13:05 bar today would have gone above yesterdays 15:40 bar, making a point 3 down traverse geometrically impossible. This would have definitely caused me to know that my MADA was wrong and made me go fix my annotations. With the mental shift of bars, the down traverse remained in play and I continued on from point 3 into the traverse.
I'm curious to see other people's annotations today to see how the gap was dealt with.
-
I'm curious what best bounds a trend:
method 1- placing point 2 where it creates the most volatility for the trend (not necessarily at the point of volume sequence completion of the point 1 to 2 move) or
method 2- always placing it where the volume sequences completed for the point 1 to point 2 move
For example, I placed the LTL for the traverse at 10:55 today (method 1). I see Ehorn has it at 13:15 (method 2).
The choice of methods could possibly color one's view of whether something like a FTT (of the traverse) or VE (of the traverse LTL) is on the table in the NOW depending on the situation. I suppose either way, the faster trend FTT (FTT of tape post traverse point 3) with volume sequence completion shows us the change in market mode.
Thanks everyone for the help.
-
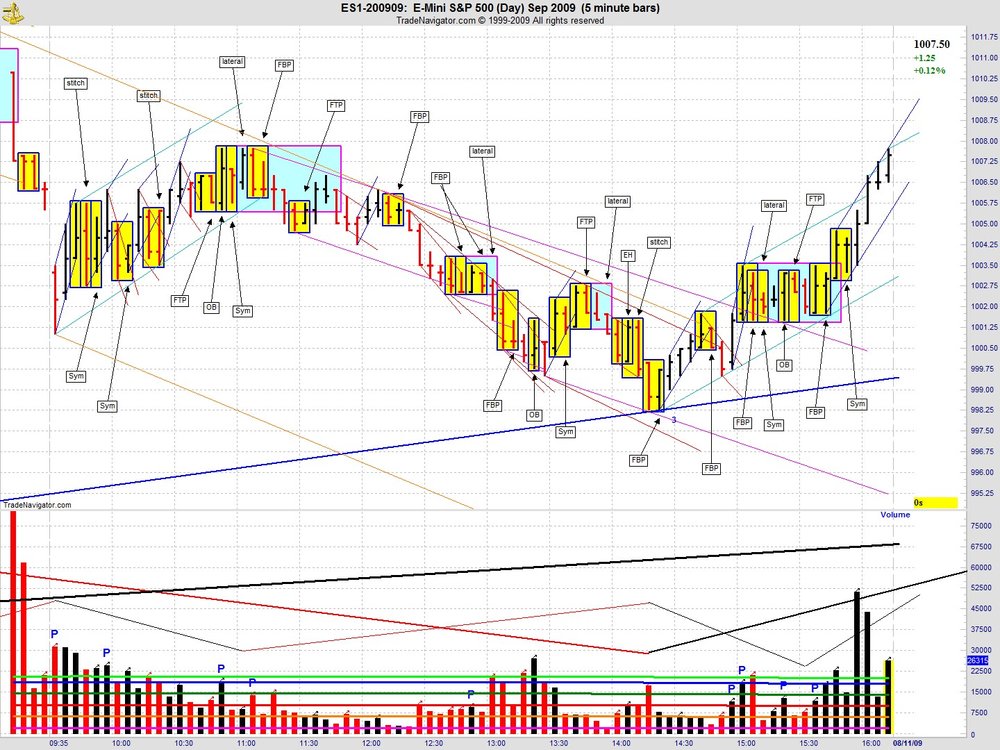
Here's my first chart posting. I want to thank everyone for participating in this thread. It has been enlightening and helpful for me. I want to especially thank Spydertrader for showing us the "how" and "where" of learning how to learn.
I worked off of the beginning point that point 1 of the forming up traverse began 14:50 of 8/6. I saw point 2 as 13:35 of 8/7. That made the 9:35 bar today as point 2 of the forming down tape and bounded the rest of the day in the carryover tape. I was anticipating the completion of the down tape and a traverse point 3 which arrived at 14:20 today.
I need to do a review to see if this view has been confirmed or invalidated by the market.


The Price / Volume Relationship
in Technical Analysis
Posted
I'll chime in with a response to treeline and NYCMB's questions.
http://www.traderslaboratory.com/forums/34/price-volume-relationship-6320-160.html#post91418
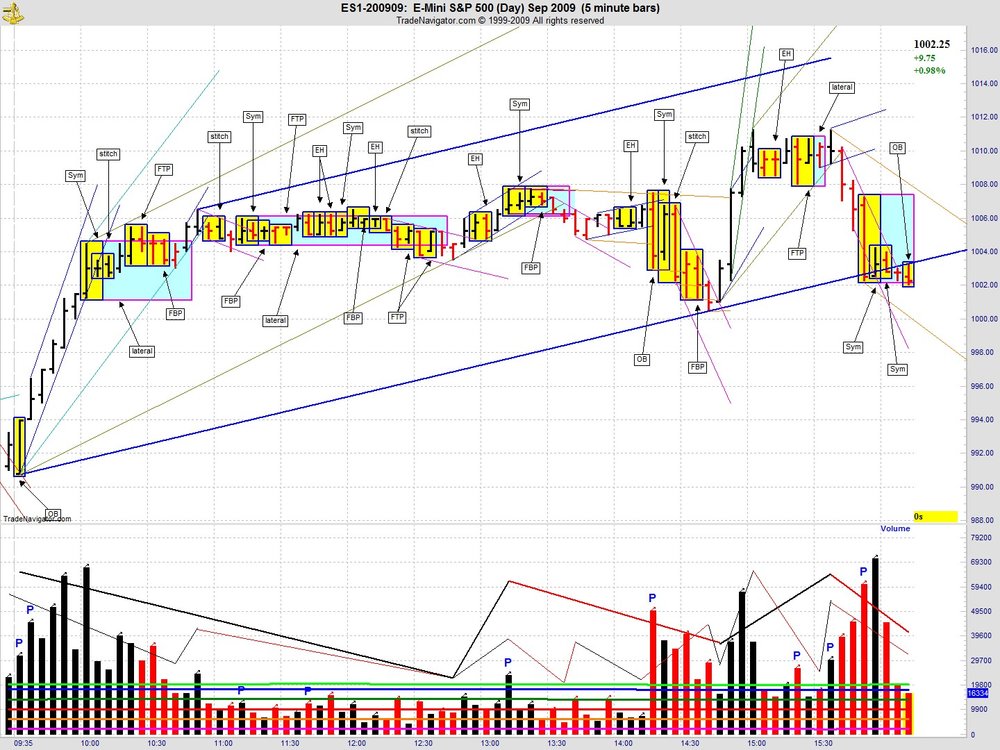
I'm sorry that I didn't respond earlier, but I had personal things I needed to take care of this past week. First of all, as treeline wrote the line weights and numbering on my chart imply that I viewed those several thin weight guassian trends in question as being on the same fractal. I suppose the confusion arises from one not seeing a full volume cycle in those cases. Let me propose a different way of looking at things. This will give you insight into why I annotated this area the way I did.
1. Volume cycles always complete across all fractals.
2. The market's volume cycles are not bound to the bar duration that we choose.
3. Therefore, the volume cycles don't always "look" like we think they should look like. Even though two volume cycles are on the same fractal one might exhibit the traditional "look" and the other might not.
4. If we can differentiate what the volume cycle "looks" like in these varying situations we can arrive at certainty in real-time (with just our ES 5 min chart).
So here is my rationale behind the first two containers of the day (11/24) that are in question. Let's call the thin green container from 11/23 16:00 to 11/24 10:00 “thin green 3 container” (the third move of the medium weight trend) and the thin brown container from 11/24 10:00 to 10:25 “thin brown 4 container” (the fourth move of the medium weight trend).
thin green 3 container:
I see a volume trough at 11/23 16:10 and a volume peak at 11/24 9:35 which gives me a thin weight b2b. Next we have an IBGS bar (11/24 9:40) and an EH bar (11/24 9:45) on decreasing volume which gives us our 2r. Finally we have our increasing volume peak at 9:50 giving us our 2b. Is the problem that you don't see a red bar in the price pane or volume pane to draw in the 2r like you would think you should have? Because of the fixed bar duration you might not see any red in the IBGS bar, but it surely must be there. Likewise I see red volume in the EH bar as price at some point travelled down to the low of the previous bar. It just so happens that it closed above the open and the software is coded to color this as a black bar.
So if we make an assumption that the thin green 3 container indeed warrants a thin weight guassian cycle, what do we make of the thin brown 4 container? In hindsight, one would have to conclude that a thin weight guassian is warranted for the thin brown 4 container because of the simple fact that the 10:50 bar exceeded the 10:00 bar. Here's why I is see a completed volume cycle in thin brown 4 container even though it doesn't "look" like one would think it should.
thin brown 4 container:
There was a 10:00 new homes sales announcement that one should have been aware of. One should anticipate declining volume into the announcement (9:55-10:00) followed by increasing volume at the announcement. We get that on the 10:05 bar giving us our thin weight r2r. Notice that the 10:05 bar had more volume than the highest volume of the thin green 3 container. In my opinion, this is further evidence that the thin brown 4 container is on the same fractal as the thin green 3 container. We went from increasing black to increasing red in the relative peaks between the two containers. I just don’t see the thin green 3 container and thin brown 4 container area as being part of one big thin weight guassian when the 2r is has a higher volume peak than the b2b. However, I would propose that you could see this phenomena across equal weight containers as we make our way, for example, through a typical U shaped volume day. Therefore, I pegged them as being separate volume cycles of equal weight. The next question is where is the 2b of the thin brown 4 container. I view two things happening at once transposed on one another. You have a declining volume from the 83k 10:05 bar mixed with the thin weight volume cycling. The 83k volume news bar could be anticipated to be unsustainable volume wise. One would anticipate declining volume going forward especially since there was a 10:30 crude announcement which we should have a volume trough before. Sometimes the declining volume masks (or dominates) the cycling and we don't see the 2b trough to the 2r peak. What we do see is the 10:15 IBGS bar giving us our 2b. You can also see the volatility compression and then expansion across the 10:05-10:20 bars to see the retrace. One can further take into consideration bar overlap on the 10:10 to 10:20 bars to see the retrace. The 10:20-10:25 bars show price coming off the point three and into the trend. WMCN doesn't come though (increasing red) which indicates change and by implication tells you there was a completed volume sequence. The 10:35 increasing black OB after the crude announcement and the following bars bear out this hypothesis as the 10:50 bar breaks the high of the 10:00 bar.
You might agree or disagree with what I wrote, or more importantly the market might agree or disagree with some or all of what I wrote. However, this at least gives an insight into why I drew what I drew on the chart. Hope it helps.