
Welcome to the new Traders Laboratory! Please bear with us as we finish the migration over the next few days. If you find any issues, want to leave feedback, get in touch with us, or offer suggestions please post to the Support forum here.


aquarian1
-
Content Count
9 -
Joined
-
Last visited
Posts posted by aquarian1
-
-
Try to understand the market behaviour in terms of exhaustion rather than change of trend ,,, When price exhausts @ Certain LEVEL then direction changes ... price exhaustion is the back bone of any auction market. Most quantitative Algo's including the one used in our Bank uses exhaustion theoriesGrey1
Thank-you for sharing this Grey. I appreciate your insight.
I would certainly agree with your statement. What measures do you suggest to measure price exhaustion?
Is it cumulative volume within a specific time parameter of the exhaustion price? For example, in a volume spike at a key price point if the last 3 minutes of volume exceeds the average volume by a factor of x do we have a price exhaustion?
thanks again,
-
You appear to have misunderstood my post. In its entirety, you asked if there was a way to tell if point A marked an intraday trend change. I provided a chart which showed support and where that support came from and how trading that support correctly would enable you to take advantage of the trend change.In other words, if you understand trend and consolidation, if you understand trading ranges, if you understand the support and resistance that result from these ranges, and if you understand how to read traders' behavior as they approach these levels of support and resistance, THEN it is possible that you will detect these reversals and trade them profitably. But none of this has anything to do with indicators or moving averages or anything that is in any way complex. It needn't even involve volume, though if you wanted to do so, I showed you how to do so in a follow-up post (#29).
If you elect to go the indicator route instead, then the answer to your question is more likely no, it probably isn't possible.
Hi phoenix,
I don't think I misunderstood your post. My original post started with:
"I have a question I am looking for help on.Has someone found a reliable indicator, or combination of indicators, or some other way, that from their personal trading experience can tell if an intra day direction change is a trend change as opposed to a retracement?"
You answered how you felt was most helpful - which was or some other way and I appreciated your post and subsequent ones. You offered your solution and that is positive. My question did not close out price action only, or indicators, or any combination.
re:
That is great. Of course, my provided sample day was only one example to clarify my meaning."I provided a chart which showed support and where that support came from and how trading that support correctly would enable you to take advantage of the trend change."As I posted, I appreciate all positive responses. (They are easier to profit from if they are not pushed as the only way.)
Thales offered;
"My advice to the original poster is this: Dedicate yourself to removing all indicators from you chart and spend two and half months really focusing on learning to read price action. If, after two and half months of studying price you are still unable to trade profitably, then you either do not have the ability to read price (which is doubtful, even a child can tell up from down from sideways), or (and this is more likely) you are psychologically unfit for trading, and you must seek to understand how your fear is controlling your trading rather than your knowledge of price action, and learn then to control your fear."{so we have;
"Dedicate yourself","
"even a child",
"still unable to trade profitably",
"psychologically unfit"
- all emotive phrases and basically saying
"my way or the highway".
I am unclear why Thales can make judgments about someone he has not met or how this encourages others to share their ideas. If one has fundamental leanings they need not be foisted upon others}
I do not see this type of emotive battering in the thread I refer to above. Might this be because it was "the approved" price only area of the board?
Is it the exact same question
If I had realized how divided this board was and how argumentative, I would have removed all indicators from the example chart I included. Perhaps I would have been best just to post the question.
However, it is not an outrageous question and similar questions have been posted. I wanted everyone who had something positive to add not feel intimidated out of posting.
One person may feel a task is impossible (for them) and that's perfectly all right. But they need not shut down others along the lines of "well he already said it can't be done - so I better not post my idea or suggestion". This is not helpful.
No doubt Edison was told many times the electric light could never be made - that it was impossible. And recording a person's voice - he was accused of being a fraud. The list goes on and on.
It is very hard to achieve something if you start out with the idea that it is impossible.
A much better post would be:
"in my opinion it is very difficult to determine what you are asking. However price support congestion and price/volume response may offer the most fruitful area of investigation."
or
"From my experience, I have not yet solved the question you are posing and I feel that the task may be so difficult that I have given up trying.. however you could try looking at...."
In short, a closed statement of what can and can't be done is not helpful and I posted the question for helpful ideas.
Happy trading
-
This is not the right place to ask such a question. You need to visit an oracle for that.In other words, if you are not a clairvoyant there is no way to tell that in advance. ...
Hi Head,
I visited the oracle. After making my donation of a silver dinar (you pay first), I was told:
"The God favor you. You shall find that which you seek."
Pleased with the counsel, I turned to leave and on the arch above the marble doorway was written,
"If you believe a task is possible or if you believe it is not, you are right."
The sunlight sparkled upon the Aegean sea and in the blue sky above, I noticed 3 white doves. One of dropped a sprig of laurel at my feet.
-----
"And then There Were Three..... Breakouts, Retracements and Reversals."
is but another way of asking the question (for a trend change is a reversal)
The very first poster to this thread said that it is possible:
Sure. ...[/center]
For you to declare:
"This is not the right place to ask such a question."
is both overbearing and negative.
Let us keep the discussion friendly.
Many people have offered good leads.
happy trading
-
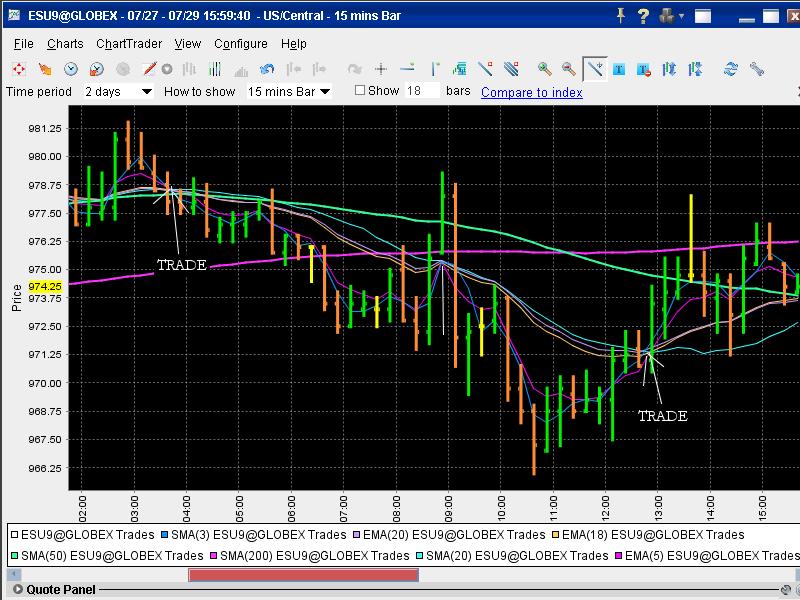
Hi Tams,I use SMAEMA20,EMA18,5,SMA3 on 15 minute ESU . the 50 and 200 SMA's are used for trend. When the four lower MA's cross I take the trade in direction of the trend. If you care to comment I welcome your input. Here's a picture of today.
Hi Figaro,
I don't quite understand
"when the four lower MA's cross"
I've made a graph and my guess as what you mean.
Do I have it correct?
You have:
SMA20,
SMA3,
EMA 20,
EMA 18,
EMA 5,
for knowing when to trade.
and you have:
SMA 200,
SMA 50
for your trend and therefore the direction of your trade.
-
First I would like to thank all of you for your contributions.
I will try to respond individually as well.
Originally I was toying with posting a simplified chart to clarify what I had intended by by question, but I thought that most would understand I was asking a more general question and decided to not waste time as I already had my end of the day printed chart.
Perhaps I should have posted my simplified chart with the original question and without any indicators on it so as to better focus the question.
I am not closed to new ideas and certainly a few have come forward!
Thank-you all.
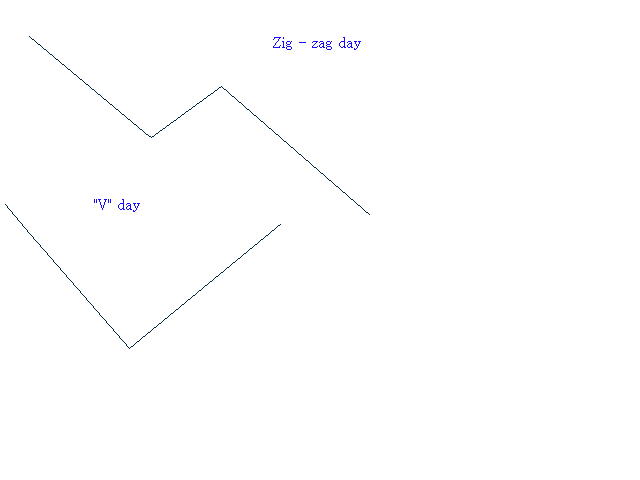
Rephrased and simplified.
"Is the day going to be a zig-zag day or a V day?
-
Thanks Tam,
I'll check out the volume leading price idea.
-
However, when I day trade stocks, I use a 5 minute chart, and I do keep a 20ema on that chart. Whether I like it or not, it is an undeniable fact, and one that I can prove empirically each and every day, that when a stock is trending strongly from the open on a 5 minute chart, price tends to find buyers in an uptrend and sellers in a downtrend when price pulls back to that 20 ema. ....
He has ema's, fibonacci's, pivots, mid-pivots, trend channels, cci, volume, some other thing I do not even know what it is. But, he trades one "set up" only, and it is entirely a price action, support and resistance based set-up.
Now, does the fact that he also uses 27 or so of his favorite indicators disqualify him as price action trader? I would say no. I think he is absolutely a price action trader (I also happen to think he could do away with every last one of his indicators and still trade his set up well, but who am I to argue with a guy whom I know to pull in five figures from his trading per week, week after week from the comfort of his sofa).
...
Best Wishes,
Thales
Hi Thales,
Thank-you for this well thought out post.
You highlight a very strong point.
Your forex friend makes 5 figures a week consistently. I feel this is very important - he has results. If indicators help support and or clarify his thoughts on price action, then they are helpful aids to his decision-making process.
Indicators are derived from price and and sometimes volume information by investors who wanted to see it there was additional insights provided by the indicators to improve their results. (Or in some cases had no results and wanted to write a book or sell their system, though this can apply equally to price action only traders.)
I have noticed that some individuals use indicators in ways that may not have been intended by theorists or even the indicators originators and sometimes in junction. That is they may really be using 3 indicators as one composite indicator. However, from their actual trading experience, this was helpful in making profits.
Though "price action" purists may say any chart that has any indicator on it invalidates the trader from being a price action trader - they do speak strongly of support and resistance levels and "the action the market takes at those points".
If floor traders and market makers use a 20 bar EMA on a 5 minute chart (for example), and if their actions are a major part of "the action the market takes at those points", then their trading using this indicator is an important, and perhaps key part of the "price action".
So the feedback loop closes.
So I do not believe: Any chart that has any indicator on it invalidates the trader from being a price action trader.
For myself, the essential thing is to develop a reliable system that consistently makes profits and hopefully one I can back-test to know when I can apply or not apply that system.
Ian
(PS I have not read enough of the thread on "price action only" to know what the terms means - in the context of this board.)
-
I have a question I am looking for help on.
Has someone found a reliable indicator, or combination of indicators, or some other way, that from their personal trading experience can tell if an intra day direction change is a trend change as opposed to a retracement?
To explain my question further, some days the first leg is down, it retraces, and then the second leg is down, that is Leg2 is in the same direction as Leg1. On other days, the first leg is down and then it reverses trend and the remainder of the day is an uptrend.
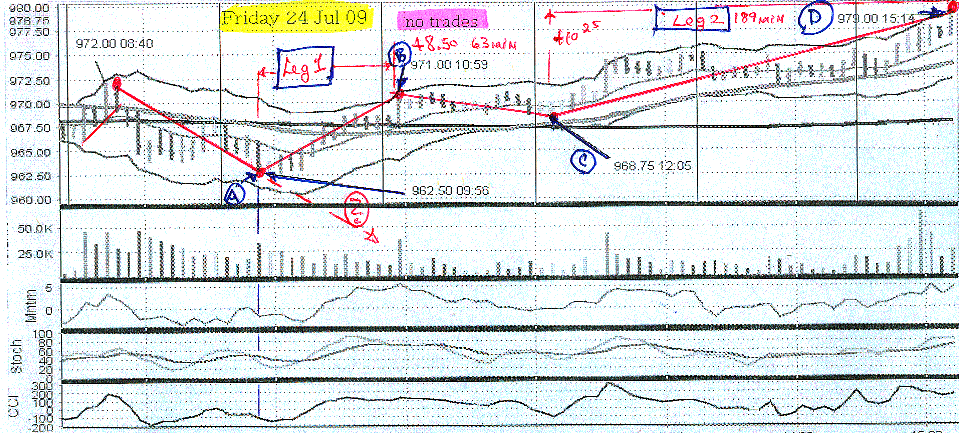
I have included a 5 min chart of Friday 24 July 2009 for the ESU9 (S&P emini Sep 09) contract, as an example (all times are CT).
From 972 at 8:40am it fell to 962.50 at 9:56 (marked point A). From A it rose to 971 at 10:59 or +8.5 pts in 63 min (point B). A to B I am calling Leg1.
Next it retrace to 968.75 at 12:05 or –2.25 pts in 66 mins (point C). Then it rises to 979 @ 15:14 or +10.25 in 189 mins (point D). From C to D I am calling Leg2.
In this example point A marks a Trend Change with the balance of the day now upward.
So in reference to this graph, my question is:
“At point A is there a way to tell that the balance of the day will be up?”
In other words:
“Is there a way to tell if point A will be marking the beginning of a retracement, that the next leg after the retracement will be down, that is in the same direction as 972 to 962.50, or is it a intra day trend change?”
I would note that one book waits until it has risen from A and it continues to rise beyond 61.8% or 968.25 and if it does then a trend change has taken place and the rise is not a retracement. (972-962.5 = 9.5*.618 = 5.75+962.5 =>968.25 = 61.8%.) I am looking for an answer at point A so this “if it retraces more than 61.8% it is a trend change” is not the answer I am looking for.
Thank-you to all.
Modified Regular Trading Hours
in Market Internals
Posted
I have been thinking about doing studies based on a different set of trading hours for ES rather than 8:30 to 15:15 (RTH) and 15:30 to 8:30 Globex. I have noticed that on some days (especially straight up or straight down) that the move will often start before RTH. For example, 7:15am. If a trading day was built with different hours e.g. 7am to 15:15 modified regular trading hours (MRTH), then OHLC are different.
This will give different indicator values
(e.g. CCI, SAR, BOL Bands, ATR, etc. etc.)
also gaps will be different - and gap closings
and candlesticks will look different.
Before lauching off on this I thought I would ask people thoughts on it.
1. Perhaps someone else has already tried this and could share their thoughts.
2. Perhaps a better start time than 7am?
3. Other thoughts?[8D]
As always I would ask negative, bitter and closed-minded people to just move along to another thread without comment.
(Nothing positive or useful to say - then just don't say it.) Forum trolls need not apply.