
Welcome to the new Traders Laboratory! Please bear with us as we finish the migration over the next few days. If you find any issues, want to leave feedback, get in touch with us, or offer suggestions please post to the Support forum here.

Dinerotrader
-
Content Count
728 -
Joined
-
Last visited
Posts posted by Dinerotrader
-
-
Dinero,I will attach a blown up chart with very few lines. There is a major trend line and a trail line. The pluses you see are the entries and the two sets of dots are the money management and full target. All of these numbers are in your data window. Very visual and easy to see targets, stops and entry. If you want I will do a video recap of a day. I hope this helps.
Not a big fan of video. Simple chart annotation of why you entered and exited and how you used your indicators would be fine.
-
Dinero,Today was great. I was talking to someone who had backtested and studied Crude and he said that on Tuesday 9am-10am was the best time to trade. I think 70% win rate.
That would depend on your trade setup. You appear to have many things on your chart but not sure what to make of it, how you are entering, and where your entries and exits are.
-
Dino,I fogot to ask, what time do you trade CL. Just the mornings, all day or the afternoons?
I normally only trade pit hours and sometimes pre-market if things are setup up well with S/R levels. I prefer to only trade the first 3 hours of pit but it changes.
-
Some days the 5 minute chart just makes the setups seem obvious. I was sooo close to catching that big move up. Got stopped out by a couple ticks just before it happened.
-
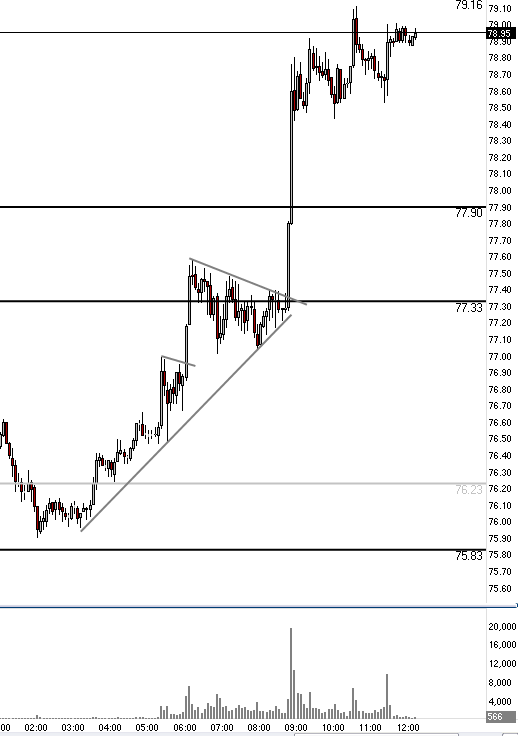
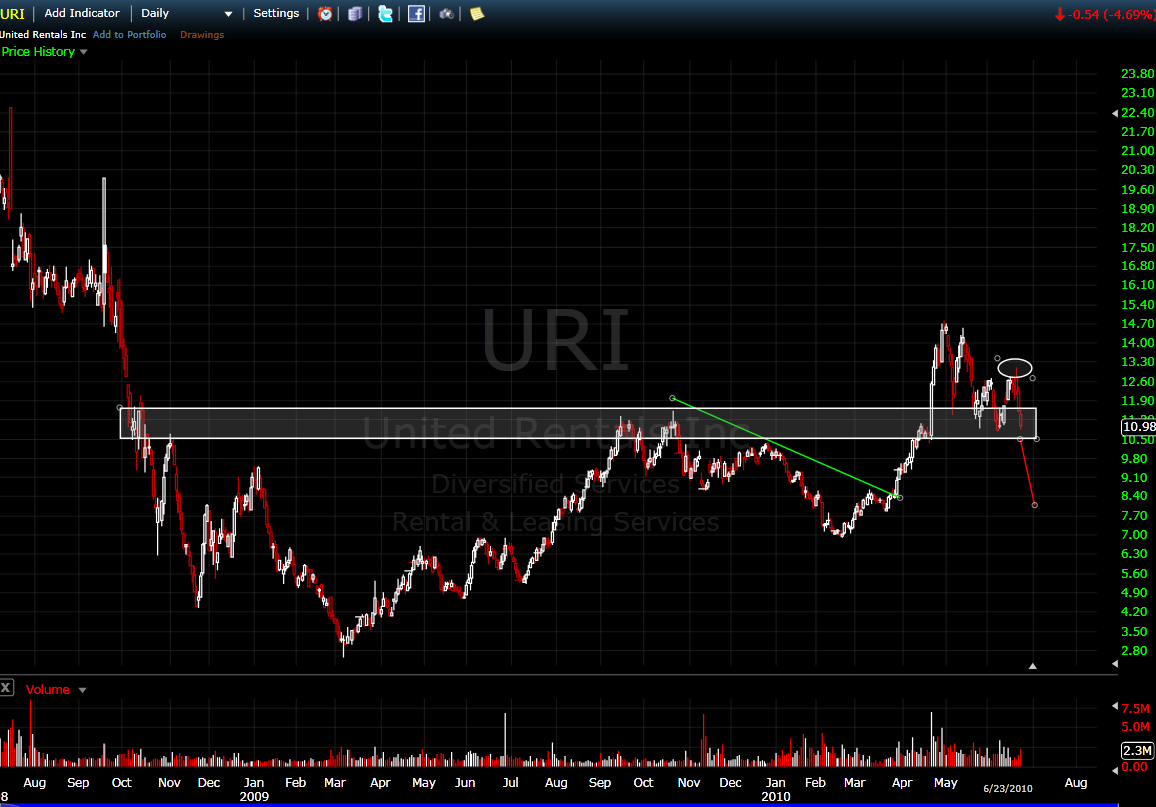
Can you see this one?...I can see the chart in my original post, so i'm a little confused...hopefully this will work...thx...URI
I can see your original pic now but I couldn't this afternoon. Thanks for posting. Here is how I see this one. I would be looking short unless some bullish price action shows up. Seems like a large S/R area there to deal with so could set up long or short depending on the following days.
-
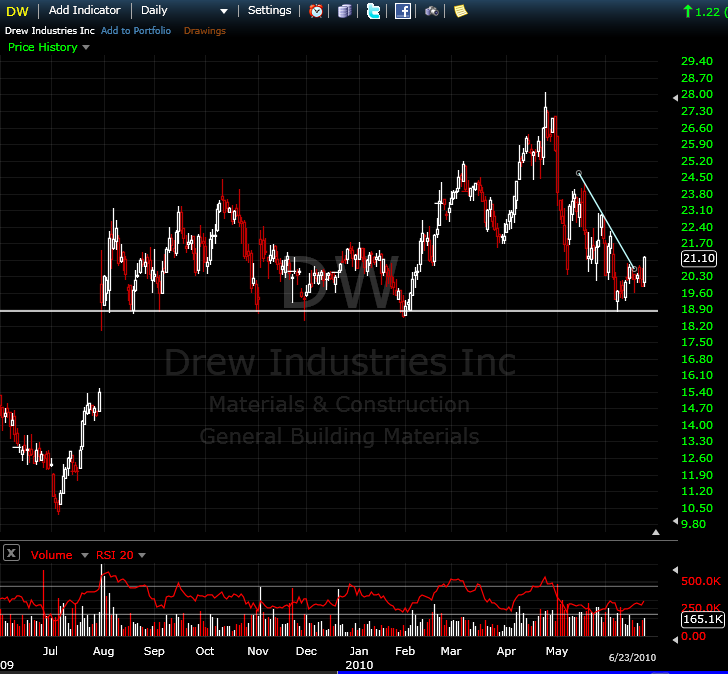
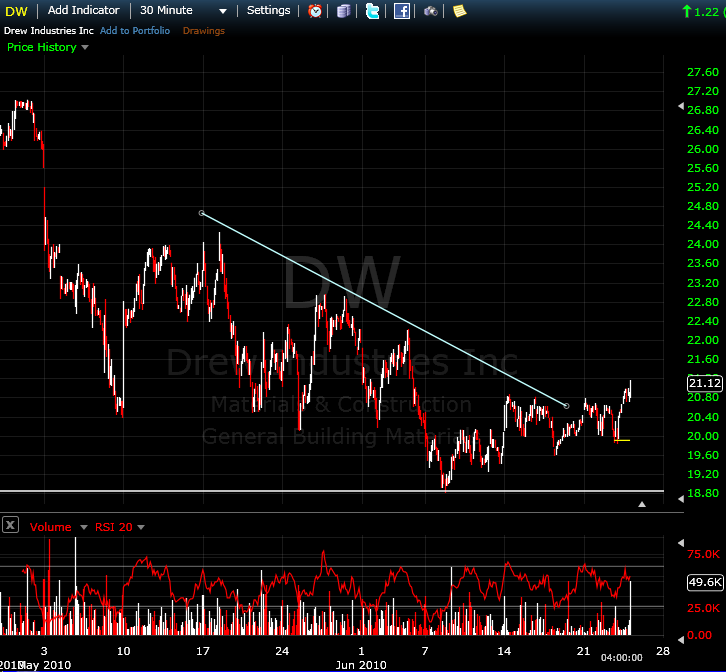
DW
That is one serious support level! Got the 123 move up and trendline break today. I'll try to watch this tomorrow.
-
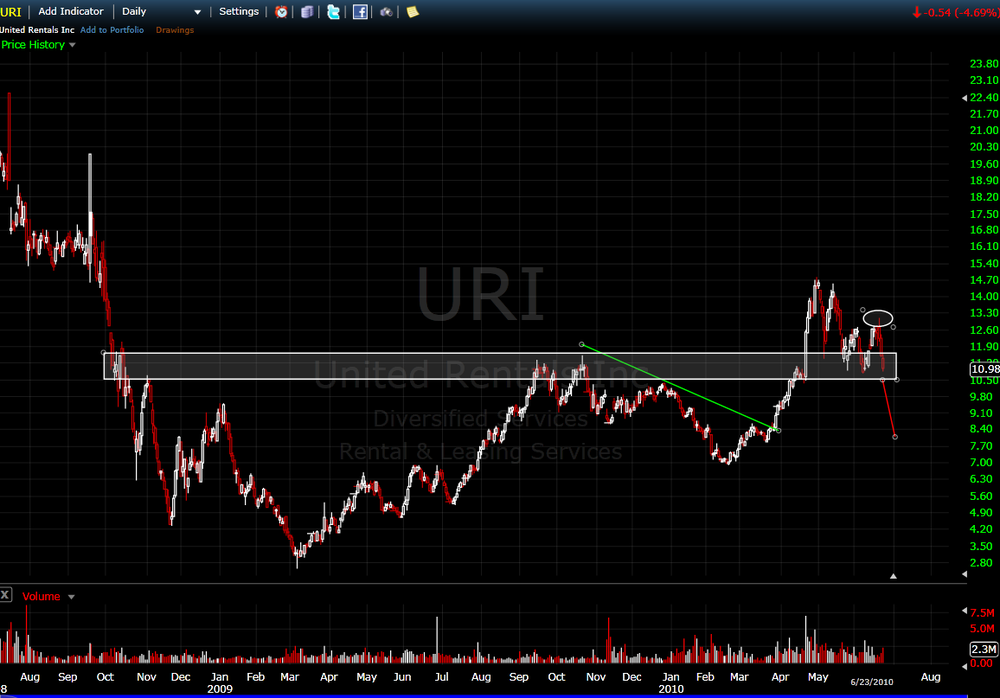
URI...Don't know if this will hold...it's a mid-channel support play with some consolidation at whole number...
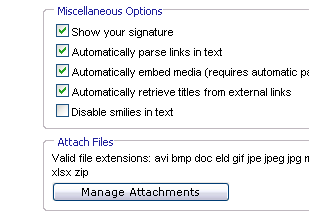
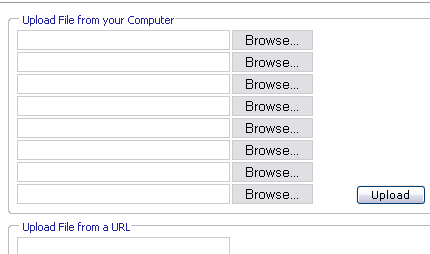
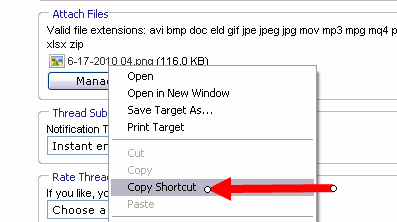
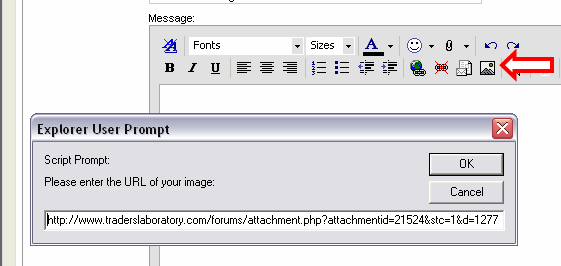
Can't see your image. Upload the picture to the forum and paste into your post. Here's how to do it.
Click on "manage attachments"
Browse to find your picture and upload it.
Right click your picture link and choose copy shortcut.
Click on Yellow "insert image" icon and paste the short cut you just copied.
Now you have a post with a pic of your chart for all to easily see.
-
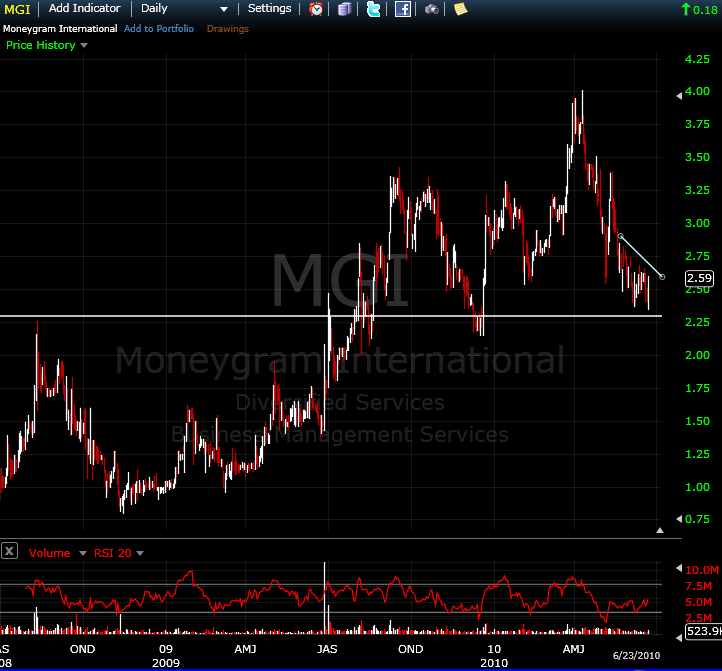
MGI
A bit of divergence/consolidation there as price nears support. I'll be watching for a 123 on a 5 or 30 minute chart.
-
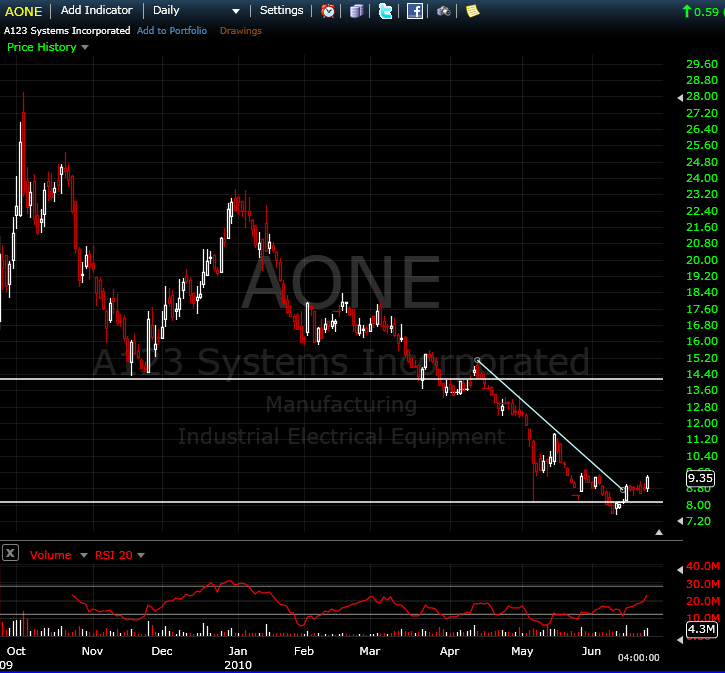
AONE
Reversal already occured but here is one I am watching for an opening.
-
oh cool! a thread where folks are calling trades in real time. and for a second i thought everyone just made imaginary trades in hindsight. lol. and lookie here, worden charts, my favorite for stocks. lol. this is great. imma have to participate and throw some eod stock trades out there.here we go, a penny stock! how much fun is that? this one looks like it is waking up.
The point of the thread is to post a chart with annotations of a stock that appears to be setting up for a possible trade before the trade takes place. Stock price doesn't matter much to me but volatility does. I watch quite a few stocks with low prices (penny stocks) which were much higher priced before the housing crash because many of them experience large moves on a regular basis. I hardly even look at pharma stocks like RPC that you suggested because their moves are often too dependent on news events and I am primarily a technical trader and I am never aware of news events and such related to the companies I trade.
-
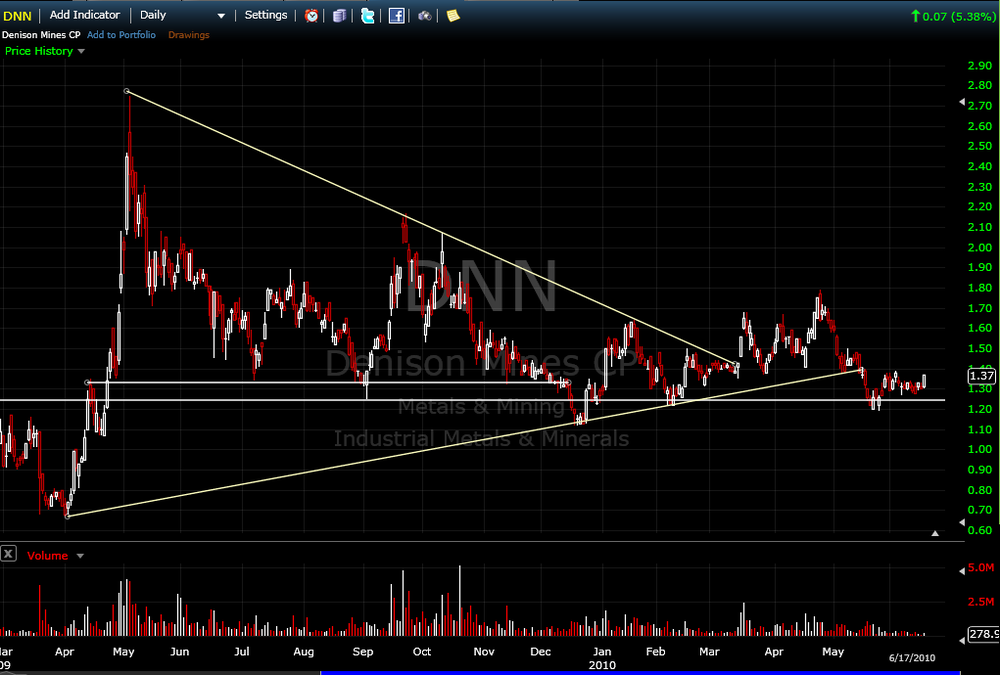
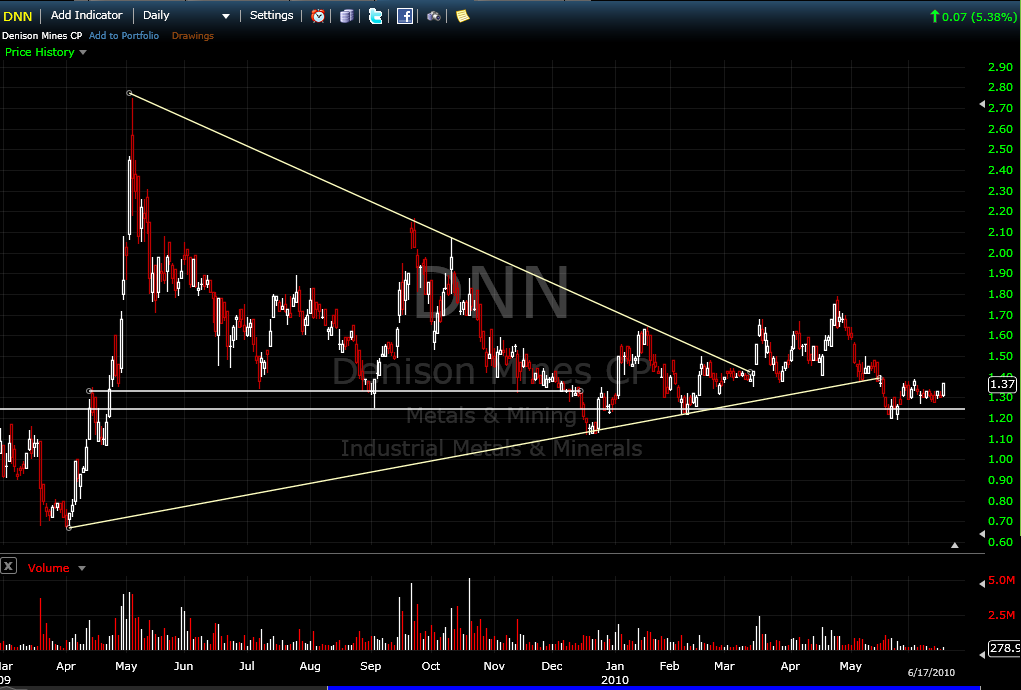
DNNI finally got in this one at 1.35. We'll see if we can get a good jump out of it tomorrow or early next week. If the ES breaks down though, I'll probably dump it.
Got out at B/E. Just wasn't showing the momentum I expected and ES started looking bearish.
-
Post a self portrait of yourself done only in MS Paint. Okay, its not really a contest, just a time waster for fun. Here is mine.

-
Here is the problem I see.
There is a great level of randomness to the market and it is very easy to start feeling like you have a context in which to trade and that context turns out to be incorrect. An example might be, today has no news announcements and its highly likely market will be rangebound so I start trading expecting that and it turns out to be a hard trending day. My expectation of context was dead wrong. I'm not saying this is a correct contextual clue, I'm just saying that is the type of trap I think context analysis can give you. The context issue is normally why I think you hear traders talk about how they would be much better off if they didn't override the system that they developed to trade.
I'd really appreciate the input from someone on what context they think is accurately readable and useful in their trading to further this discussion.
The positives for a setup is that you can trade that setup no matter the market conditions and have plans in place in the event the setup is not working that day or in that type of market.
-
This looks pretty good except I can't tell it when the close is. I only want to have it draw the high and low for the pit hours of oil, not open to next day open. Is there a way I can add a close time into the code. I pasted the code below. Thanks.Inputs:Time_Start(0630);
variables:
var0( 0 ),
var1( 0 ),
var2( 0 ),
var3( 0 ),
var4( 0 ),
var5( 0 ),
var6( 0 ),
var7( 0 ),
var8( 0 ) ;
if Date <> Date[1] then begin
var0 = var0 + 1 ;
var1 = var2 ;
var3 = var4 ;
var5 = var6 ;
var7 = Close[1] ;
var2 = Open ;
var4 = High ;
var6 = Low ;
end
else
begin
if High > var4 then
var4 = High ;
if Low < var6 then
var6 = Low ;
end ;
condition1 = var0 >= 2 and BarType < 3 ;
if condition1 then
begin
Plot1( var1, "YestOpen" ) ;
Plot2( var3, "YestHigh" ) ;
Plot3( var5, "YestLow" ) ;
Plot4( var7, "YestClose" ) ;
end ;
I tried adding the bold section below but didn't seem to work. I can't tell where the code is referencing the Time_Start so I can add a condition that it needs to be less than or equal to a Time_End input.
Inputs:Time_Start(0630), Time_End (1130);
variables:
var0( 0 ),
var1( 0 ),
var2( 0 ),
var3( 0 ),
var4( 0 ),
var5( 0 ),
var6( 0 ),
var7( 0 ),
var8( 0 ) ;
if Date <> Date[1] and Time > Time_Start and Time <= Time_End then begin
var0 = var0 + 1 ;
var1 = var2 ;
var3 = var4 ;
var5 = var6 ;
var7 = Close[1] ;
var2 = Open ;
var4 = High ;
var6 = Low ;
end
else
begin
if High > var4 then
var4 = High ;
if Low < var6 then
var6 = Low ;
end ;
condition1 = var0 >= 2 and BarType < 3 ;
if condition1 then
begin
Plot1( var1, "YestOpen" ) ;
Plot2( var3, "YestHigh" ) ;
Plot3( var5, "YestLow" ) ;
Plot4( var7, "YestClose" ) ;
end ;
-
It is working here; I don’t trade GCL so I just assume that’s what you want.The setting will be:
Set current profile time zone to UTC-6
Set GCLU0 session to 9:30AM-4:00PM , chart style "candlestick". (OHLCyerterday must have this GCLU0 as input)
Install ‘OHLCyesterday’, time 0930, high and low colors , line type “point”. If you don’t want yesterday open and close set to transparent.
If you want to print the overnight chart for continuation patterns,
insert /add symbol/GCLU)/overlay/right axis. set chart style to OHLC bar.
Set the time for that new overlay in order to cover the time out of the cash: 6:00PM-8:30AM.
I see what you are saying but I am hoping to not adjust my charts to the indicator but instead adjust the indicator to my charts. Does that make sense. I already have more than one overlay on my charts and I need them to stay at 24 hours. Of course I don't know how to code so I am hoping someone knows how to add the time close attribute.
-
DNN
I finally got in this one at 1.35. We'll see if we can get a good jump out of it tomorrow or early next week. If the ES breaks down though, I'll probably dump it.
-
Just set the time and line colors.This looks pretty good except I can't tell it when the close is. I only want to have it draw the high and low for the pit hours of oil, not open to next day open. Is there a way I can add a close time into the code. I pasted the code below. Thanks.
Inputs:Time_Start(0630);
variables:
var0( 0 ),
var1( 0 ),
var2( 0 ),
var3( 0 ),
var4( 0 ),
var5( 0 ),
var6( 0 ),
var7( 0 ),
var8( 0 ) ;
if Date <> Date[1] then begin
var0 = var0 + 1 ;
var1 = var2 ;
var3 = var4 ;
var5 = var6 ;
var7 = Close[1] ;
var2 = Open ;
var4 = High ;
var6 = Low ;
end
else
begin
if High > var4 then
var4 = High ;
if Low < var6 then
var6 = Low ;
end ;
condition1 = var0 >= 2 and BarType < 3 ;
if condition1 then
begin
Plot1( var1, "YestOpen" ) ;
Plot2( var3, "YestHigh" ) ;
Plot3( var5, "YestLow" ) ;
Plot4( var7, "YestClose" ) ;
end ;
-
I can relate to your question and to your way of trading. I used to have a lot of success fading markets but like you said, on a strong trend day you can really get bit. What I learned was that a reversal trade should be teamed up with some other types of setups too, so you can take advantage of the current market condition. I wound up giving back a lot of hard earned gains by trying to fade a charging market. No indicator will give you the crystal ball information you seek. If it were that easy, it wouldn't be legal, right? You have to be the federal government for the right to print money.I ended up arming myself with different setups. I teamed my reversal trades with a breakout trade, a continuation trade and the willingness to stop and reverse based on the rules to my tradeplan. I went out and learned about dynamic trade systems that tune themselves to market conditions based on price action. Now if I get in a reversal long for example, and that trade fails, I'll get a short setup that will cut my losses on the long reversal and will get me short for a high percentage chance of succeeding. It's all about living on the right edge of the chart. Best to not be one dimensional, in my view.
I'm not really looking to change my trading strategy, just improve my ability to identify strong intraday trends. Not seeking a crystal ball, just looking for other's ideas on ways they have found that help in finding the trend.
-
I am primarily a reversal trader. My main concern of course is to make sure I am not taking a reversal trade in the middle of a strong trend. I am wondering what methods others use to gauge trend strength, breadth, etc.
Does anyone use a reasonably reliable indicator that gives them an idea if they should stand clear of reversals for the moment because of a trend?
Just curious what others out there have used when trying to identify a move strong enough to end up an intraday trend.
-
After having thrown away every indicator from charts many months ago and deciding to strictly trade ranges I have a question for more experienced traders. Would you share how you trade around s/r levels? My main problem seems to be setting stops. For example, resistance is at lets say 1100 on the ES. I set an order to buy just above 1100 on what appears to be an up-trending move and get filled, only to get the usual head fake and watch price decline below 1100 and continue to decline, then get stopped out only to watch price reverse in my direction. And, of course, if I hadn't put on the order at all then price would blast thru without me on board, etc.
I know there's no cookie cutter answer or solution, but any suggestions are welcome - thanks.
Couple questions/thoughts.
What S/R levels are you using to trade with on what time frame chart. S/R can be determined using weekly, daily, minute, and tick charts and then the question is what time frame chart are you using to trade one of those levels.
An annotated chart of a trade you took would help also to see what you are doing, how the S/R was determined, where the trade was entered. Just post a couple charts from the last day you traded. The more information you give the easier it is for other to give useful help.
There is some great threads on TL about S/R trading but I'd direct to different places based on how exactly you are trying to trade it.
-
Were you looking to from RTH hours or from globex open?I only trade during RTH so I need the RTH high/low from the prior day on the current day RTH time period.
-
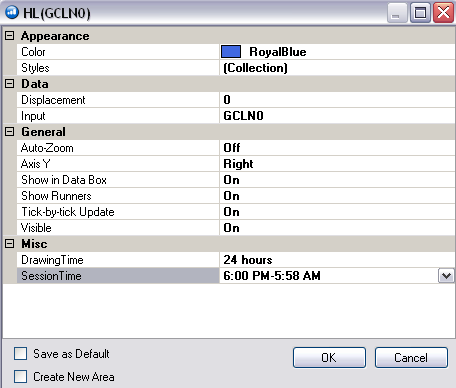
I use OEC and am in need of an indicator that just tracks the prior day's high and low. Does anyone have such an indicator in EL that would compile in OEC?
There is an indicator for the current day High/low but not the prior day (see pic below for what the current day settings look like).
-
Dino,What are you trading? GCL? I just finished backtesting GC on the 500 tick and it is kick ass with over 75% win rate since Jan. I am going to start trading it live on the next setup. It is in a long right now that just hit first target. I will be happy to share my results and data with you.
Please do share here in the thread so we can discuss. I only trade the CL but still just SIM. I could certainly live with a 75% win rate.

-
I haven't posted the last few days because I've been too frustrated that I can't seem to improve my win rate. It appears I am still able to be net profitable most days but intraday drawdowns are too large. I have a few variations on my setup to try out next week so we'll see if that produces anything good.
Trader P/L 2010
in Traders Log
Posted
SIM
Slow inventory day on oil. Good moves though. We'll see if I can get myself to keep posting on a daily basis.