
Welcome to the new Traders Laboratory! Please bear with us as we finish the migration over the next few days. If you find any issues, want to leave feedback, get in touch with us, or offer suggestions please post to the Support forum here.


Yakalfer
-
Content Count
33 -
Joined
-
Last visited
Posts posted by Yakalfer
-
-
-
-
-
That is a good question ! ;-)
-
Is it possible to find this ratio on MultiCharts strategy performance summary ??
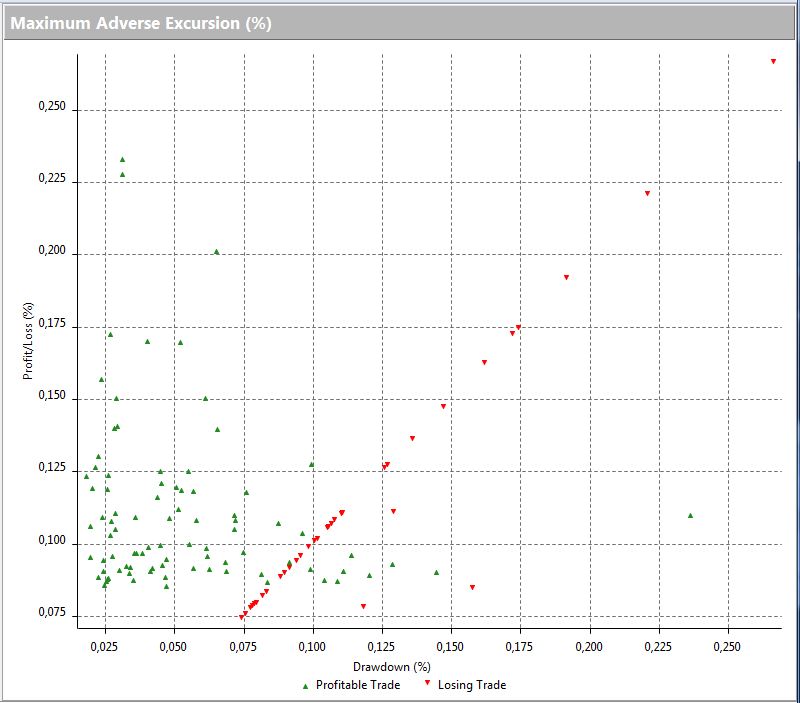
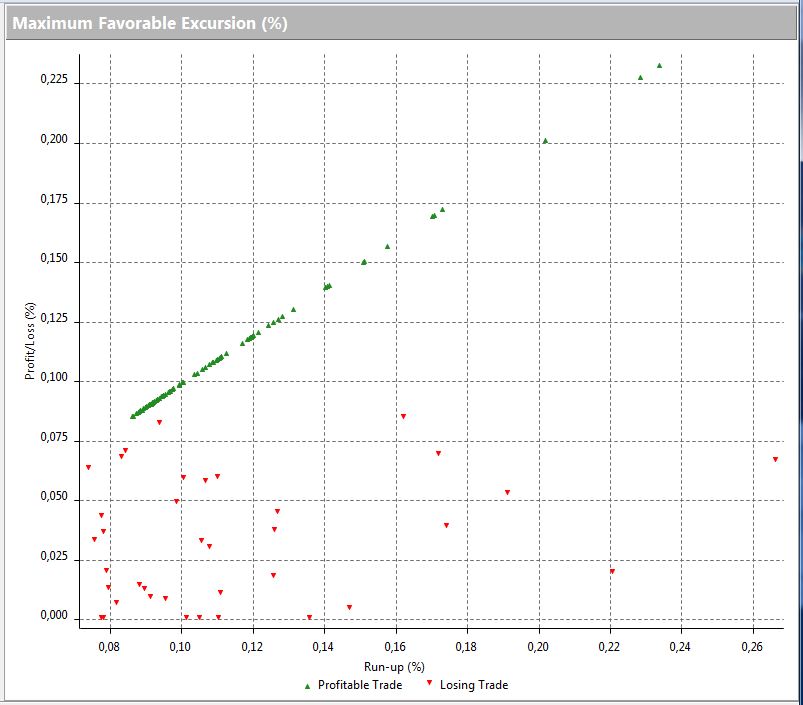
Maximum Favorable Excursion (MFE) and the Maximum Adverse Excursion (MAE) are on the Trade Analysis section but I don't know how to read these two charts...
And I don't find the ratio MAE/MFE...
Thanks for your help.
-
What is the performance ratio the most relevant??
Is this the Profit Factor or Sharpe ratio or something else??
What indicator used to rank performance of the strategies ...
-
Thank you for this answer!
Indeed, tssupport has solved my problem.
However, I would like to know if there are on this forum, traders who use MC in Automatic Trading on a Forex account, to share with them the pitfalls and tips on this topic ...
-
For months, I try to use the Auto Trading with MultiCharts on the forex market.
The strategy itself is fine and gives correct results in backtest mode and real time mode on FXCM data provided by IQFeed.
The problem appears when I try to use the automated trading on FXCM account.
The strategy does not calculate at all the exit price in the same way as in 'Real Time' Mode.
The one and only difference I see between the two situations is that in local mode, the strategy uses fxcm data provided by iqfeed, while in Auto Trading the strategy uses Real-Time Data from Broker (fxcm broker in my case...)
And the only parameter associated with the data and may justify the errors of calculation could be the Big Point Value (BPV) of the instrument.
In the case of data used locally, the fxcm data provided by iqfeed, the BPV is set to 1, and verifiable through QuoteManager.
But in the case of Real-Time Data from Broker used by Auto Trading, I have no way of knowing what is used as the BPV ...
Assuming that the BPV is say, 10000, how can my strategy runs well in Real Time Mode (BPV=1) AND in Auto Trading Mode (BPV = 10000)?
Briefly, what is the solution to my strategy has the same behavior with two values of BPV??
Thank you in advance !
-
Thank you all for these answers!
To avoid contamination of the thread I confine my question whether TS is the right software solution for testing strategies ;-)
-
I just bactest a strategy that runs on the intraday forex unit time 15 minutes.
Without optimization, this strategy shows a profit factor of 5 over the period tested.
I optimized one of the parameters, which improved the profit factor to 7.
I then tested this set of parameters on a new period of data, which confirmed the return.
Finally, I turn left the strategy on a demo account and then the strategy burn the account ...
Therefore I would like to know what it is like books and literature on the issue of backtest ...
-
because... your backtest is blank.What do you mean ???
what can I do ?
what is the answer to my questions ?
-
To backtest properly and profitably (I use TS), can you tell me sites, articles, books to learn how to do and why today my backtest highly profitable materialize by systematic loss ...
Thank you in advance!
-
My correspondent at FXCM told me that it is possible on the real accounts but not on the demo accounts ....
-
Hello,
Is it possible to send orders generated by a MultiCharts signal toward a Metatrader Expert Advisor?
My initial need is to test on a demo account strategies developed on MultiCharts ...
I have not found a broker that allows the use of Forex demo accounts with MC.
So, I wonder if it is possible to transfer to a Metatrader EA, signals generated by MC ..??...
Thanks in advance !
-
Thank you for your help !
I am not looking for someone who write my code, but only to say me what EasyLanguage function I need to reach my target.
Because I have the "EasyLanguage Functions and Reserved Words Reference" but I'm not able to find for exemple how to use the macd line and the macd histogram... Because on page 216 of this reference manual, there is only few lines about macd function...
In the same way, I'm not able to find by myself what is the function I need to color the candle...
And all this is not on the first chapter of the "EL_Getting_Started" book :embarassed:
Have a nice days,
PS : I'm using currently alerts that I created with ninja wizard in minutes, without writing a word of code
 ...
... -
The two lines are the only code I use...
if Close > BollingerBand(Close,11,2) and MACD(Close,12,26) > 0 then plot1( 1, "test+" ) ;
if Close < BollingerBand(Close,11,-2) and MACD(Close,12,26) < 0 then plot2( -1, "test-" ) ;
I would write a warning indicator when the price breaks the bollinger band while the MACD is positive and the MACD histogram is positive ..
In this case, my dream is that the candle of the graph changes color and an alert sound.
So I can use this indicator in the Real-Time Market Scanner ...
As a first step, I need to understand how to use the MACD: how to retrieve the values of the MACD and the MACD histogram?
What is the instruction to change the color of the candle?
Thank you!
-
ok, but for exemple, I write :
if Close > BollingerBand(Close,12,2) and MACD(Close,12,26) > 0 then buy next bar at market ;
if Close < BollingerBand(Close,12,2) and MACD(Close,12,26) < 0 then sellshort next bar at market ;
But how can I use the macd line ??? I need to add a condition macd line > 0 for long and macd line < 0 for short and I found nothing ine the user manual..
Thanks in advance,
-
I need a Real-Time Market Scanner and it seems to me that it does not exist in NinjaTrader ...
To schedule a simple strategy as (MACD> 0 and macdligne> 0 and price crossover BBup), where can I find help?
-
Thank you Tams for your help.
I just finished studying the book, but I am unable to set an alarm between a bollinger band, a MACD and the price ...
This is not as "easy" as that ... :hmmmm:
This indicator took me 1 minute on ProRealTime, 10 minutes on NinjaTrader, and I fear it requires me 1 week on MC ... :embarassed:
So, what can I do ?
And is there any website where I could find some free indicators and strategy (exemple : pivot point, macd in color, etc, ...) ???
Thanks in advance !
-
Hello,
I'm starting with MultiCharts and for my first programming exercise, I would like to generate a signal and an alert if the following conditions are present:
Condition1 =macd line >0
Condition2 = macd histogramme >0
Condition3 = price cross over upper bollinger band
Could you please help me to write this code ?
Is it an indicator or a signal or a function ???
Thanks in advance,
-
And what about MultiCharts vs TradeStation ???
-
Thanks BlowFish for these information !
I have check the market analyser and I confirm that it's exactly what I need.
I do not know if it is possible to open a demo account with IB, but I still have not found ...
-
I have downloaded Ninja, but in order to have datas, I need an account..??... I can simulate, but the target is to use the market scanner to trade ;-)
-
ok, thank you for this answer !
It looks like corresponding to my needs.
I was hoping to find a solution that can be fully tested without needing to open an account ... (eg Metatrader).
But if I open an account, then what are the points that should make me choose NinjaTrader rather than MultiCharts ..??..
Is 100% Mechanical Trading Possible?
in Automated Trading
Posted
100% automatic trading is possible!
Products like TradeStation, MultiCharts, TradeLink, etc. exist to meet this need.
Many websites display real-time performance of these automatic strategies.
But I have never found on the web, a trader who displays the logic of a winning strategy.