
Welcome to the new Traders Laboratory! Please bear with us as we finish the migration over the next few days. If you find any issues, want to leave feedback, get in touch with us, or offer suggestions please post to the Support forum here.


nkhoi
-
Content Count
62 -
Joined
-
Last visited
Posts posted by nkhoi
-
-
anybody have video Channel for Beginner by bundlemaker? thanks.
-
Jack posted some thoughts in trading forum and career forum but they got deleted right away. I was able to so save them in chit chat forum/ technical strategy thread (click on views to sort all threads by views, it ranks fourth place)
-
Ha! Another Cor(e)y! :thumbs up:actually it is Cory but it was already taken.

-
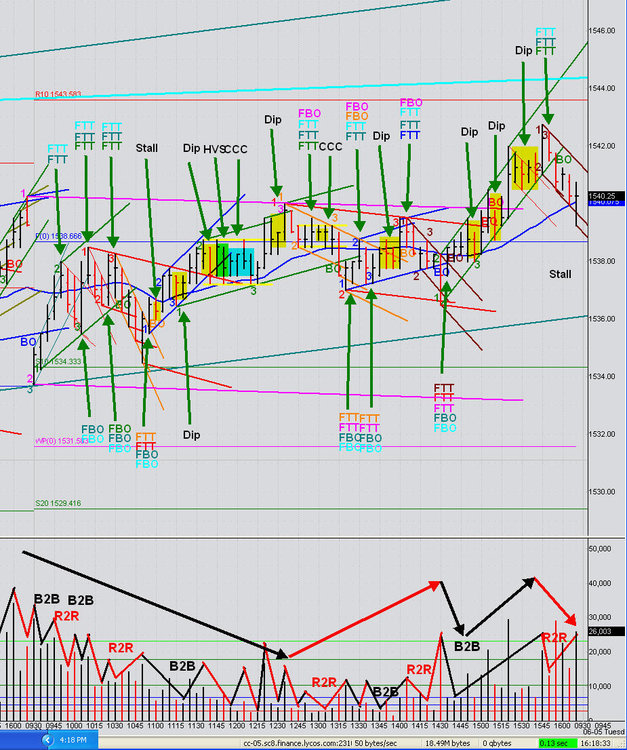
Friday 11-5-2010 5m chart
.thumb.jpg.d00378166a870b24b8485ff3cf69001a.jpg)
-
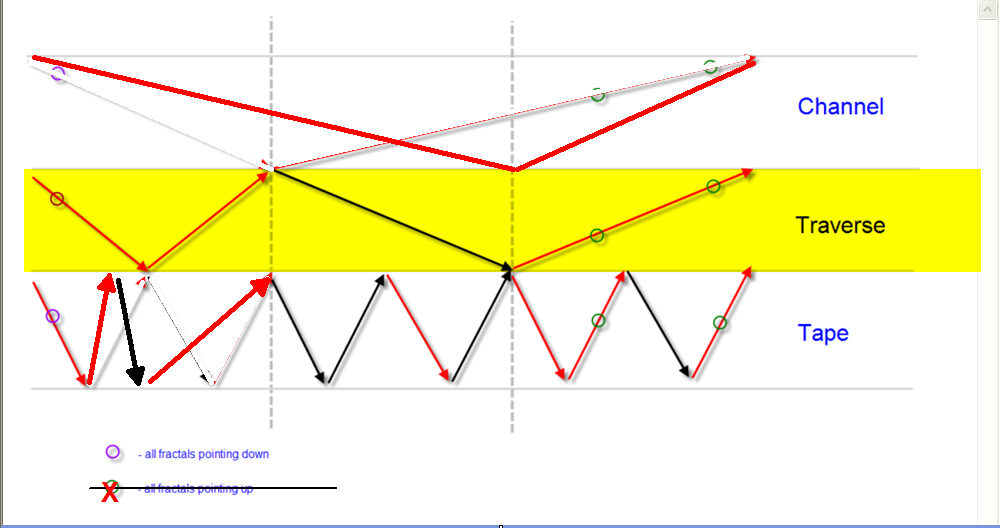
Here you go... what is called a tape in the image I took to be a traverse...what 'the man' said above also I look at picture and I notice each piece of three big pieces has 3 smaller pieces inside I think that is what the picture trying to convey.
-
Just wondering if any devout followers of this method have successfully applied it to markets in real time with real money.we were asked this question time after time, The answer way back when the method just got posted was 'may be' , 'I dont know', 'I hope so'. but now there are many 'yes' and if thing goes the way its there will be more yes still.
Simply stated, I am incredibly skeptical that anyone can apply this with any type of long term success.
Jack have been around more years than all your fingers and toes combine, if that is not long term, I dont know know what to tell you.
-
If a condition prevents you to be a winner,remove the condition.
very profound thoughts, sounds like a winner.
-
Is he immune to mistakes? ...pretty much as the chart will be dissected many times over.
-
I assume that's Jack... Is this an indirect way of saying you disagree with Sypdertrader's comments above?I dont see any disagreement, an illustration of your point?
-
see how fast you get a clear answer once you post a pic?
-
And this one too....you will now understand what I don't understand....no idea, you just has to ask the author of the pic.
-
Ok you were forewarned.. wanted to save you guys the trouble Like I said, it seems I am missing some basics....this is an older post from spyder.
look left does 2B > R2R volume?
-
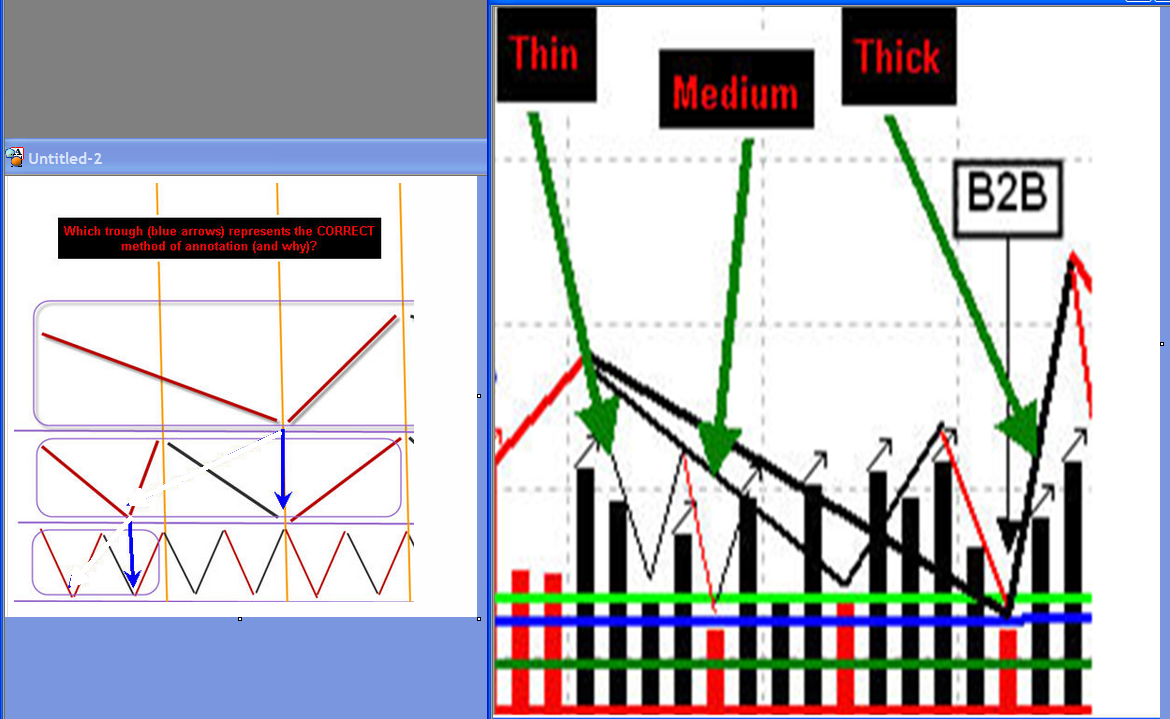
Alright.Now, we are getting somewhere. You've narrowed things down to a binary choice.
Which Trough best represents the market fractals in terms of 'nesting'?
...
- Spydertrader
looking at a official doc I think this is the answer.

-
Like I said, probably my fault, perhaps there are some basics that I am missing.You guys seem to be quite ahead on the curve. I would have to ask some pretty basic questions, and thought I save everyone some time if a document exists that clears that up...a pic worths thousands words put up a pic with some lines on it, we can take it from there.
-
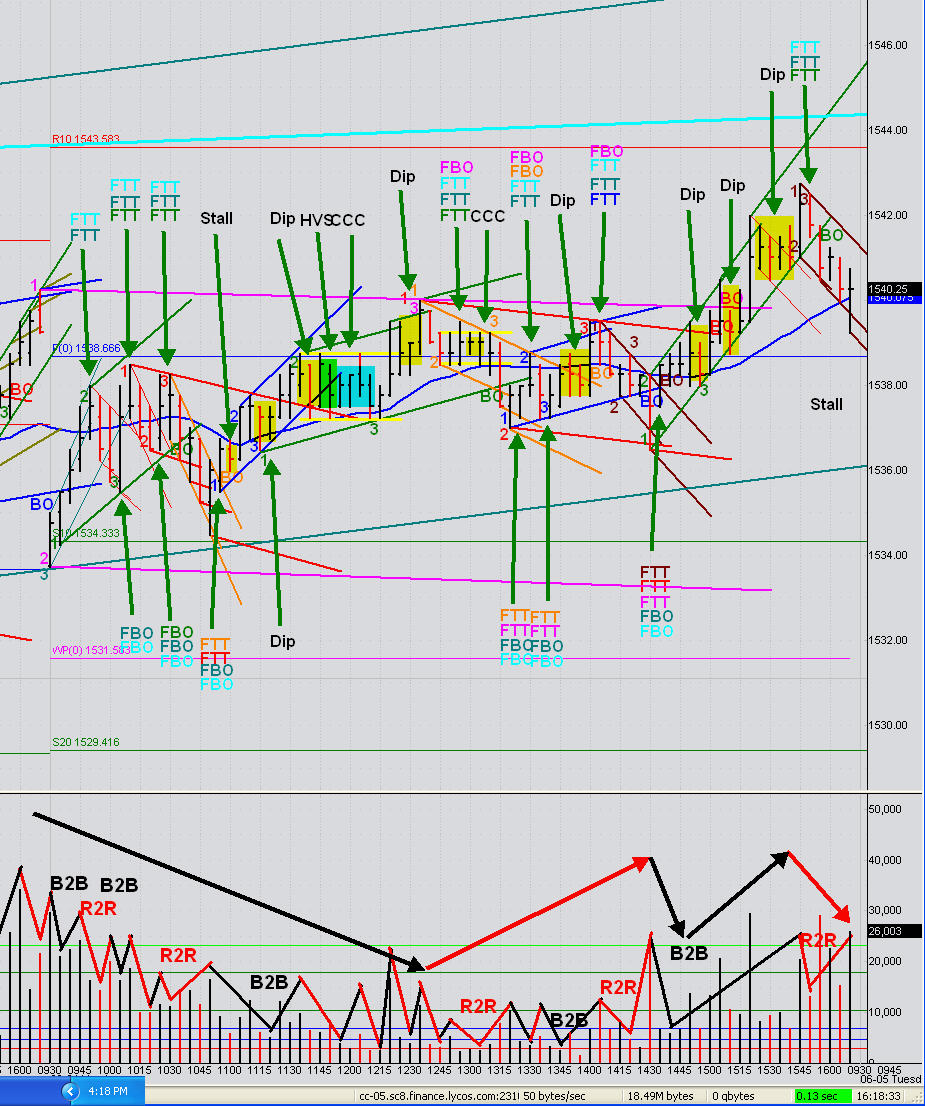
Attached is my drawing for Pt1 to Pt2 channel's gaussians. After gucci's post regarding where to put the through of B2B/R2R, seems like where one puts it is important and I'm not sure whether the way I draw it is correct. Any help is greatly appreciated. Thanks..look at post #2135, read the caption slowly...

-
my previous post seems to have vanished, so apologies if this appears twice.In order to get the gaussian thing down pat, would it be a good drill to take a bunch of charts, erase the price portion except the beginning and end bars and then try to fill in what price did just from the volume pane... thanks
go to refinement thread page #264 look for gaussian drill
-
You mean that the actual FTT bar has LESS volume?.. but let's say you are in an up-channel, you have a bar that spikes up on big black volume, fails to reach the LTL, then comes down and closes neutral or below the open- the way I saw it that would be a likely FTT.Actually, those were the only kind I could identify so far, am new to this....
you are not wrong either take a look at second green FTT and third green FTT
so you need to get your timing down pat, when to look for ftt and some clues to confirm.
-
Question (and I am sure it has been answered 100 times elsewhere, but Spyder suggested I post my questions to give somebody a chance to clarify):Can somebody point me to a specific post where the Volume pattern that identifies an FTT is clarified?
Am just getting into this stuff, it seems to me that an FTT can be either a one bar or 2 bar combination (some kind of spike/ reversal bar formation contained either within 1 bar or 2). There can only be that many combinations of price and volume that express an FTT... somebody?
Thanks,
Vienna
watch vol bar that less than prior vol bar then you you may have an FTT
-
Quite a lot of indicators you've got there. Do you use them all? Aren't volume and price enough?can't help myself , I chop off the header so that you can't count how many indis I have.
actually this is how many I have

-
A simple question about PT3's -EDIT: and one more:
If a trend is lateral (or nearly lateral) is it "valid" for PT3 to pull back past PT1 by a few ticks?
as long as you have the 'gau' supports your P3 then you should be OK.
2 lats with diff results


-
very interesting thursday(9/2) and friday(9/3) both ended with sym laterals but with subtle differences.any pic to go with that?
-
which indi? maybe i can reverse it.
-
Hmmm... well the Race is certainly showing that psychology trumps system.the thread exposed the ugly truth of fantasy vs reality.
-
Again, thanks for the reply.Your answer is very interesting to me. I met a fellow in a trading room about a year ago, who seemed to be ahead of my curve, and that gentlemen was kind enough to lend some direction.
his name?
..But it is what I am not seeing that I would like to know.
Is volume dominance best guaged by a series of bars, or paired bars, or individual bars?
vol dom starts with b2b or r2r, the smaller number of bars to create b2b, r2r the smaller channel you are looking at.
.jpg.2274e60079d2ad3553c00cd6b1132e23.jpg)
The Price / Volume Relationship
in Technical Analysis
Posted · Edited by nkhoi
I see most of PV participants have migrated here. This is reading Price Volume bar by bar indicator.
I include 2 similar Ninja PV indicators. One needs Gom indicator so that it can run on history Bid and Ask. One run real time only, it will lose bid/ask data if you hit refresh the chart. The real time indicator is posted here only.
Note: remember to change extension cs.txt back to cs only,
Tip: expand the indicator to see hash marks better.
ps.Indicator that uses Gom package works better.
Download Basic Gom package here
http://www.ninjatrader.com/support/forum/showthread.php?t=23283
BidAskPV.zip
GomBidAskPVbyJackH.cs.txt