
Welcome to the new Traders Laboratory! Please bear with us as we finish the migration over the next few days. If you find any issues, want to leave feedback, get in touch with us, or offer suggestions please post to the Support forum here.


RichardV2
-
Content Count
9 -
Joined
-
Last visited
Posts posted by RichardV2
-
-
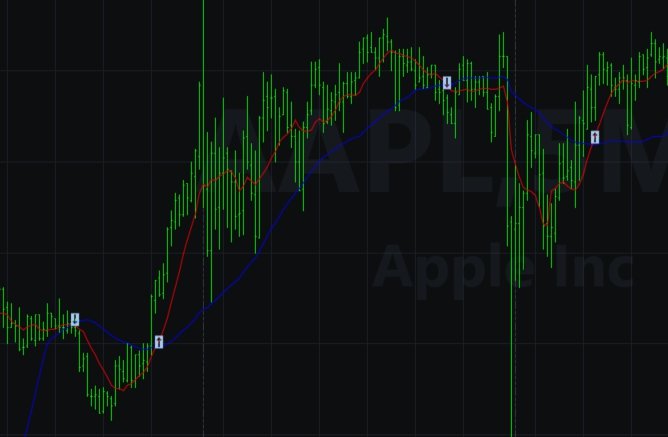
I have code that imports a small up arrow and a small down arrow.
The attached code plots a fast and a slow moving average.
Whenever the fast crosses above the slow, a small up arrow is printed.
Whenever the slow crosses below the fast, a small down arrow is printed.
Notice in the Inputs Section:
upChar("a"),
DnChar("q");
In the two main "Begin" and "End;" sections "a" becomes an up arrow when plotted and "q" becomes a down arrow. The attached photo shows two up and two down arrows plotted at the moving average crossing points.
-
This looks like a beginner question, so I'll say...
Depends.
Stock market studies usually focus on one of two areas; Fundamental or Technical.
The fundamental trader wants to know all about the company: Who is the CEO? What does the history of company earnings look like? How does the company compare with others in the same or similar business? They often read and study the company's annual reports.
The technician usually doesn't care much about the company details. If the stock price is going up, they should be a buyer. If the stock price is going down, they should be a seller.
A small portion of investors believe they should know both disciplines.
If you don't know which of the above are most appealing to you, ask about good books on general markets that include both fundamental and technical trading philosophies and techniques.
Or ask about good fundamental books.
Or ask about good technical trading books.
I have about 800 texts. About 80% are technical, 20% are fundamentally inclined, so I wouldn't know what to suggest without more information from you.
-
This should really be very easy, but I can't find an article or video to walk me through it.
I picked 20 ticker symbols where the stocks are in a tight trading range. I got them all into one list I call "Channel".
I'd like to add several indicators that apply to all, such as MACD, volume, 3 moving averages.
Then I'd like to scroll through the list, adding trendlines, or horizontal lines to mark the top & bottom of the price channel for each.
Then set an alarm for a breakout in each direction that indicates a breakout.
Could you point me to an article or video that walks me through how to do this? ...or give me the steps?
Thank you,
RichardV2, Experienced stock trader back before the Internet was invented.😁
-
All stock indexes, and many mutual funds (Called Exchange Traded Funds (ETF)) can be traded charted and treated just like any individual stock.
You can use ETFs to specialize in specific sectors of the market. For instance electronics has been really hot lately, so purchasing shares of an EFT specializing in electronics would be more than banks (which have been horrible lately). And of course the overall markets have been doing better than banks. ...anyway, trading indexes is a good way to start.
As you learn and grow, you will be able to use what you learned. For example, I often use this approach:
1. Pick the strongest market: DJIA, S&P500, AMEX, etc. You can invest in that index by itself, or...
2. From that market, pick a strong sector. For example, four of the many sectors in the S&P500 are Consumer Staples, Energy, Financials and Health Care. Let's say that you notice that Health Care is strong, then you can invest in a Health Care EFT, or...
3. Get a list of the Health Care companies listed in the S&P500, then look at those companies to find one or more candidates for an individual stock purchase.
So, you can start at the top and work your way down (or not) and your questions will lead you to finding the answers that eventually become the experience to meet your goals.
Notice that 1, 2 and 3 above all require that you be able to pick out the strength in many possible choices. This will lead you to learning technical and fundamental ways to guide you forward.
-
In the Probability section of any statistics course, you will learn that the probability of a system with 80% success (or pick any other number except 100%) rate STILL will eventually have 4 (or more) losses in a row. So, sadly, the author of this money management system has not yet found the Holy Grail.
-
I agree with all of you. I especially like the surfer analogy. You wait for the big wave and either have the adrenalin ride of your life, or get pounded into the sand with the crash. I have collected about 800 books about the markets, and just last week I slogged through about 50 of them, reading up on just the "Squeeze".
Next to my favorite, a long narrow trading range, the squeeze, although riskier, gets my attention. If I saw one right now, I might use these rules:
1. No touching until the breakout.
2. No purchase or sale without a solid escape plan, i.e. get out immediately during the run back through the trading range.
3. Go through my books again, reading up on the best way to use a trailing stop loss.
-
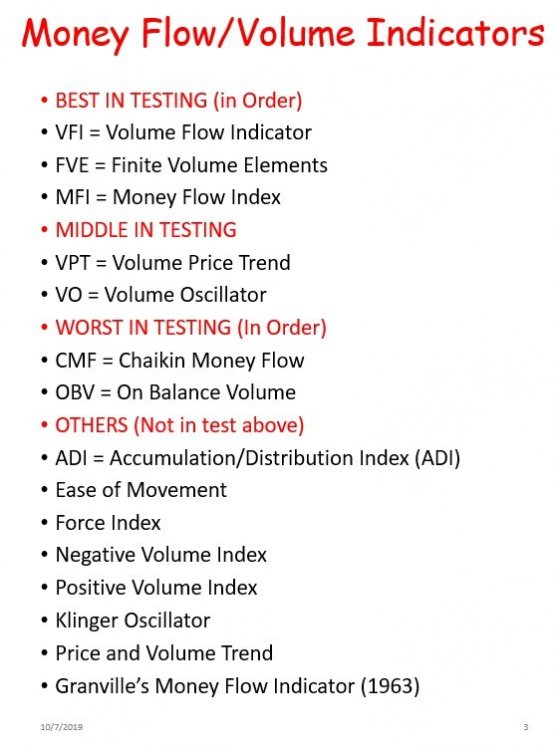
I'm enclosing a photo. I just finished reading a study published a while back. The author took 7 common volume indicators and tested them all. He found the OBV to be the worst of the 7. Here is how to read the photo:
I had a list of many volume indicators that I wanted to research. On the photo, I moved the 7 in the study to the top of the page. In the study, the top 3 were judged the best by far. The next 2 in the middle had performed better than the 2 below them and worse than the two above them. In other words, the top 7 in the photo were the in-order finishers in this study. All indicators below the 7 just were not in the study.
Now I know to use only the top 3. Or if I am on a web site that offers a few indicators, I'll look for the one that is highest on the list.
-
1. Yes, any information concerning technical analysis applies directly to funds.
2. Almost every good charting site offers charts for funds. Start by looking for ETFs or Exchange Traded Funds. (Sorry if you already knew that.)

TS v9.5 Strategy only shows Buys & Sells in last 30 days
in Coding Forum
Posted
(New to optimization in TradeStation v9.5, EasyLanguage)
When setting up to Optimize two Moving Average Crossing Strategies, (one I wrote, another from website) saw that both Strategies only display Buys & Sells in the last 30 days of a five year chart.
Buys & Sells match the algorithm, but how do I get them to start at/near the beginning of the data?