Welcome to the new Traders Laboratory! Please bear with us as we finish the migration over the next few days. If you find any issues, want to leave feedback, get in touch with us, or offer suggestions please post to the Support forum here.

Welcome to the new Traders Laboratory! Please bear with us as we finish the migration over the next few days. If you find any issues, want to leave feedback, get in touch with us, or offer suggestions please post to the Support forum here.
By using this site, you agree to our Terms of Use.


Weekly Market Analysis (Mar 11-17): Resilience of Stocks
in Technical Analysis
Posted · Edited by AdrianaLowe
Extra chart images
The theme over this last trading week has been one of remarkable resilience. After breaking down from key resistance levels, it seemed that a period of consolidation would follow. But, globally, markets instead rallied with conviction to retest their highs.
I have been sceptical about the sustainability of the rally this year. But one of the most fundamental axioms of surviving the markets is to trade what you see, not what you believe. And what I am seeing is markets that seem to want to push higher across the board, with individual stocks holding up well even when faced with bearish news.
S&P 500
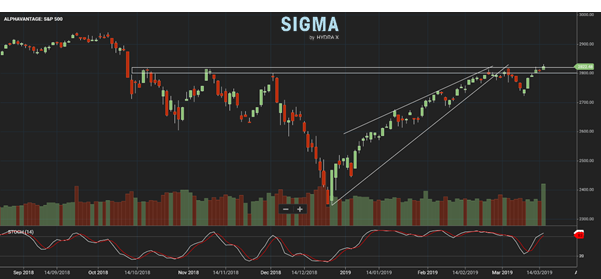
(credit: chart from Sigma by Hydra X)
The S&P closed the week strongly at 2,822.48, up 0.5% on high volume, and on the back of its biggest weekly gain since November 2018. US markets seem insistent on forging a path higher despite the overhang of earnings, macro economy news, North Korea, and ongoing China trade talks. I still wait for price to break and close clear of the congestion zone around 2,800 before entering longs, but this looks increasingly like a environment where the only rational positions to take are either to be flat or long.
MICROSOFT
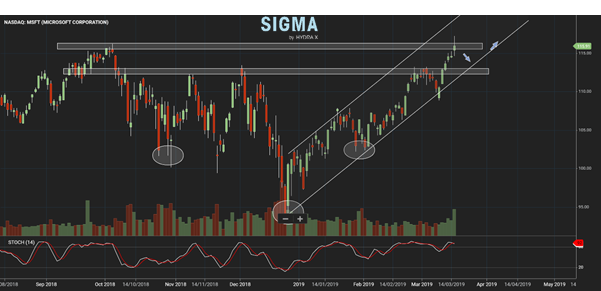
(credit: chart from Sigma by Hydra X)
Gains this week were led by tech, with the sector surging 4.9%, and also becoming the best performing sector of 2019. I find MSFT interesting, having completed a bullish inverse head and shoulders pattern, rallying in a tight rising channel, and strongly testing resistance (and also its all-time highs) on high volume. But a spinning top candlestick in the midst of overhead resistance, and a bearish stochastic crossover which in overbought territory could translate into a pullback, which could provide interesting entries for longs.
TESLA
(credit: chart from Sigma by Hydra X)
A good litmus test for market sentiment is how stocks behave on news. Tesla has held on to $275 support despite its Model Y unveiling event underwhelming analysts; BAML, CFRA Research and Canaccord Genuity all issued cautionary notes. If it gets there, $260 looks to be strong support for a countertrend rally.
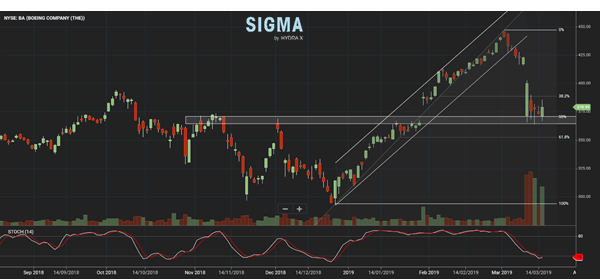
BOEING
(credit: chart from Sigma by Hydra X)
Boeing continued to suffer the aftermath of the latest tragedy, ultimately having to suspend its entire fleet of 737 MAX planes when the FAA finally followed the lead of global aviation authorities in grounding the plane. Deliveries of the 737 MAX have also been paused. The beleaguered company faces an indeterminate outcome from investigations, bills from airlines affected by the grounding of the plane, as well as potential suits from the families of victims. On Thursday, the US Air Force joined the party. It launched a blistering attack on Boeing, saying that the company has a ‘severe situation’ after flawed inspections of their KC-46 air refuelling tanker aircraft, and questioning the company’s ‘culture of discipline for safety’. [https://www.cnn.com/2019/03/14/politics/air-force-boeing-refueling-plane/index.html] Despite all this, the stock has proven remarkably well supported at $370, repeatedly rallying from those levels on high volume.
FACEBOOK
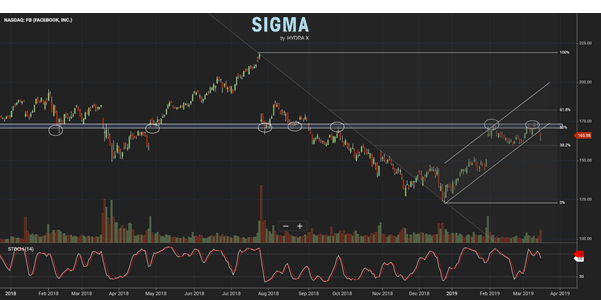
(credit: chart from Sigma by Hydra X)
No company has had a worse week than FB, even within the context of its bad year. The week started with a proposal by Senator Elizabeth Warren to break up FB, was followed by a network outage affecting its Facebook, WhatsApp and Instagram services, and then announcements of a widening federal criminal probe into its data sharing practices. Two key executives, Chris Cox and Chris Daniels also announced their departures from the company. A nadir was reached when its Facebook application was used to livestream the hate-driven massacre of 49 people in New Zealand.
Technically, the stock has broken below the bottom of its ascending channel, and key overhead resistance in the $170-173 region looks daunting. There is also a huge gap from Feb 2019 waiting to be closed.
Yet in spite of the weak technical picture and the deluge of negative news, FB closed just 2.13% down for the week, and ended the trading session on Friday well above the lows of the day, forming a bullish hammer. While I have been waiting for a clear break in one direction or the other for a while, as rising channel met overhead resistance, I choose to stay as interested spectators for now.
EUR/USD
(credit: chart from Sigma by Hydra X)
Finally, last week I noted the technical breakdown of key support levels in the EURUSD, in conjunction with fundamentally bearish news in the form of Draghi’s dovish speech. However, I was keen to stay on the sidelines, given past experience of how crowded trades tend to turn out. EURUSD didn’t disappoint, as it promptly rose in a stop-hunting rally, which would have trapped any short entries in a very uncomfortable position.